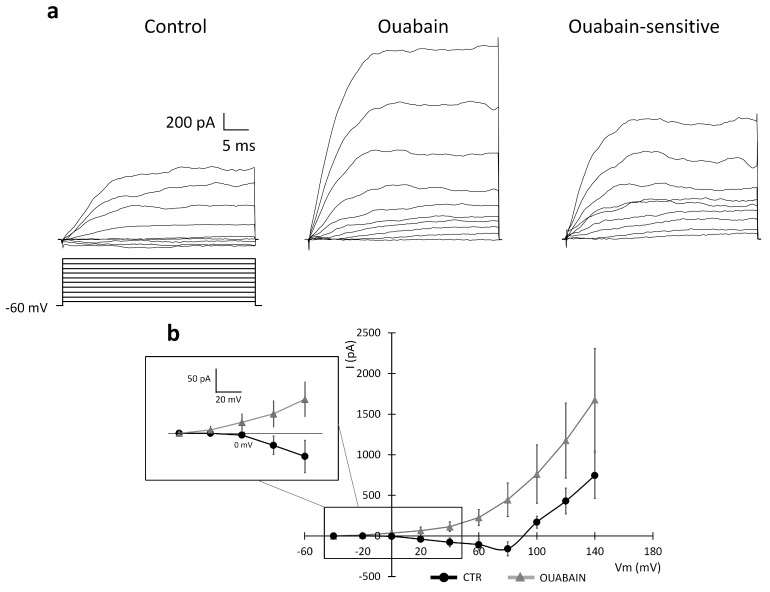
Figure 10.
Effect of the Na-K ATPase blocker ouabain (perfused for about 10–15 min) on the BK current in U251 edge cells. (a) Experimental traces elicited by applying a voltage step depolarizing protocol from a holding potential of −60 mV (protocol shown at the bottom) in the control conditions (left traces) and after the local perfusion of ouabain 500 µM (central traces). The ouabain-sensitive current was obtained by digital subtraction (right traces). (b) Mean I–V relationships (n = 5 cells) recorded in the control conditions (CTR, dots) and the ouabain condition (ouabain, triangles). Insert shows the averaged I–V in the interval range between −40 mV and +40 mV at higher magnification to show the I–V shift after the local perfusion of ouabain.

