Figure 11.
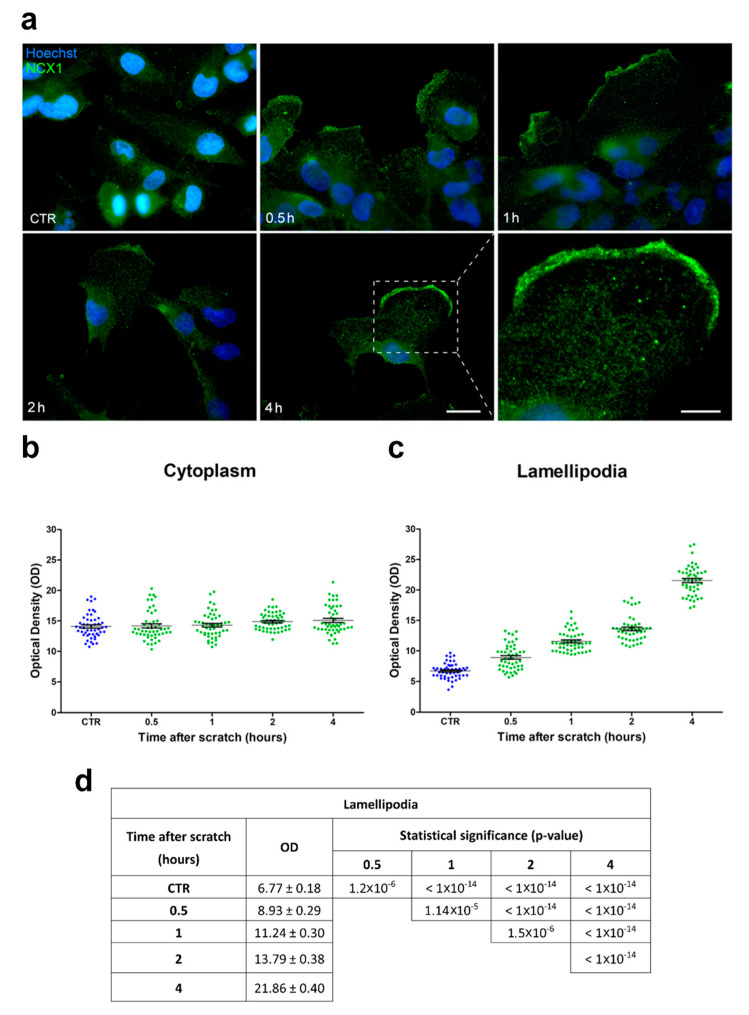
NCX1 expression in U251 cells was specifically upregulated in the lamellipodia after the scratch. (a) Representative micrographs showing NCX1 immunopositivity (green signal) in the cytoplasm and lamellipodia of cells located at the edge of the scratch in the control conditions (CTR) and 0.5, 1, 2, and 4 h after the scratch. Nuclear counterstaining with Hoechst 33258 (blue). Scale bar: 20 µm. Lower right panel: high-magnification (180×) micrograph showing the lamellipodia 4 h after the scratch. Scale bar: 10 µm. (b,c) Optical density (OD) scatter plots illustrating single-cell measurements acquired in the cytoplasm (b) and lamellipodia (c) in the control conditions (CTR) and at different time points after the scratch. Data are expressed as the mean ± SEM. (d) Lamellipodia mean OD values and relative statistical significance in the basal conditions (CTR) and 0.5, 1, 2, and 4 h after the scratch. Data are expressed as the mean ± SEM. p-values were calculated using one-way ANOVA, followed by the Bonferroni post hoc test.

