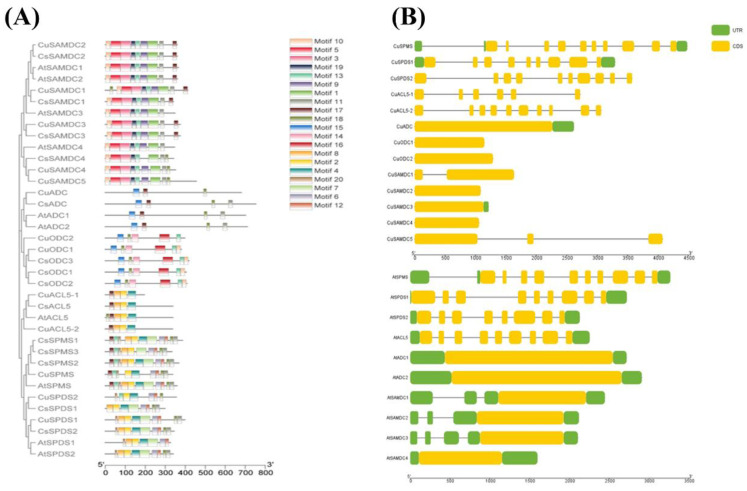
Figure 2.
The distribution of conserved motifs and gene structure in PA biosynthetic proteins. (A) Identification of motifs using MEME version 5.4.1 and visual created by interlinking it with the phylogenetic tree through TBtools. The bars with color gradients represent various motifs with different color codes for each motif. (B) Gene structure and phylogeny of PA biosynthetic genes from C. unshiu and A. thaliana. Yellow bars indicate exons and black lines indicate introns in gene structure display of the SPMS, SPDS, ACL5, ADC, ODC, and SAMDC genes.

