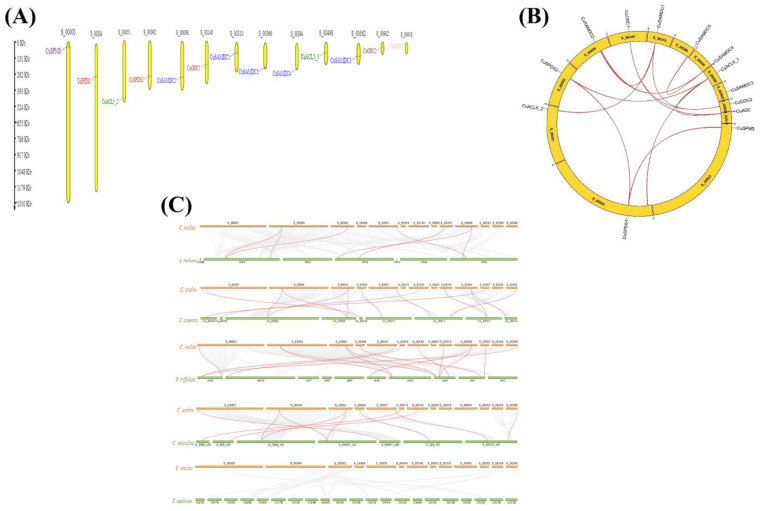
Figure 4.
Gene location and synteny analysis. (A) Distribution of PA biosynthetic genes on scaffolds within C. unshiu genome. Yellow bars represent the scaffolds, and label on the top of each bar represents the scaffold number. (B) Syntenic relationship of PA biosynthetic genes within C. unshiu genome. Yellow curved blocks represent the scaffolds and the label on top of each scaffold in black color represents the scaffold number. Red lines indicate segmental or tandem duplication event gene pairs and rust-colored lines represent the position of PA biosynthetic genes on C.unshiu scaffolds. (C) Dual synteny of C. unshiu PA biosynthetic genes with various plant species. Colored horizontal bars represent chromosomes and label on top (C. unshiu) or bottom (other plant species) of these horizontal bars represent the chromosome number of the respective plant species.

