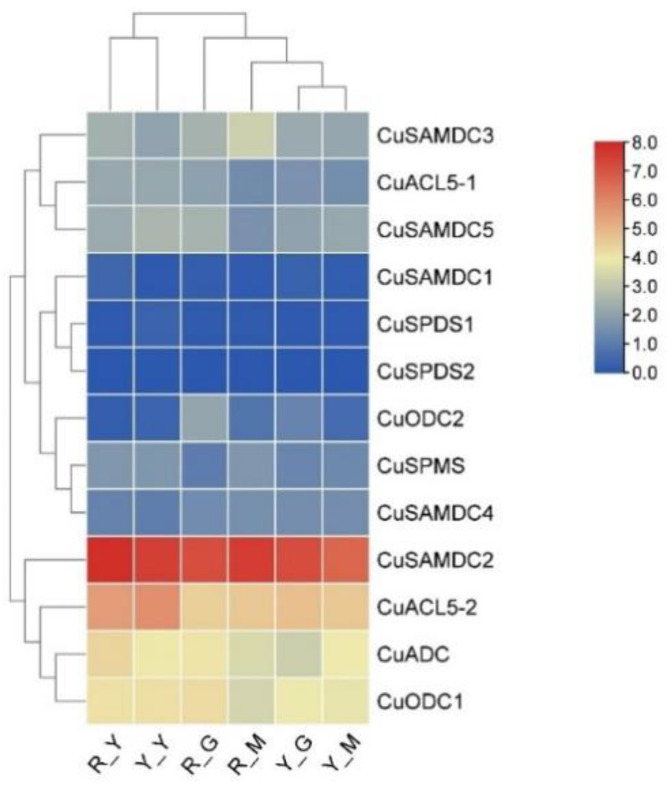
Figure 7.
Heat map showing C. unshiu PA biosynthetic gene expression in seedlings during etiolation. The seedling groups as R_G, Shiranuhi green seedlings; R_Y, Shiranuhi etiolated seedlings; R_M, Shiranuhi multicolored seedlings; Y_G, Huangguogan green seedlings; Y_Y, Huangguogan etiolated seedlings; and Y_M, Huangguogan multicolored seedlings. The color gradient represents the relative expression of these genes, with red indicating the highest and blue indicating the lowest level of expression.

