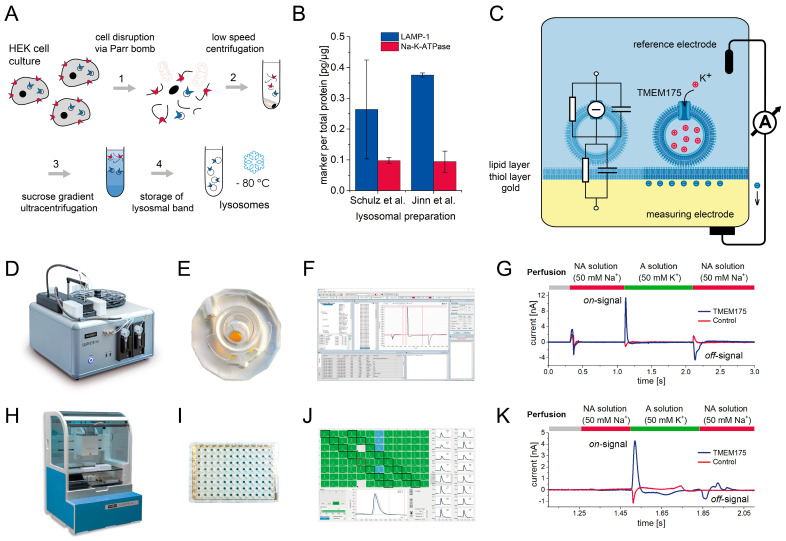
Figure 1.
Principles of SSM-based electrophysiology recordings on TMEM175 localized in lysosomes: (A) Schematic of the steps performed to purify lysosomes from HEK293 cell culture. The process is based on a protocol by Schulz et al. [38]; (B) Marker protein concentrations for lysosomes (LAMP-1) and plasma membrane (Na-K-ATPase) for lysosomal samples purified according to Schulz et al. [38] and Jinn et al. [5] were determined via ELISA. The graph shows the amount of marker proteins normalized to the total protein amount of the respective sample determined via Bradford assay. Average values and standard deviations from N = 2 samples are shown; (C) Schematic of lysosomes adsorbed to the SSM on a gold-coated sensor chip. The capacitive read-out is highlighted; (D) SURFE2R N1 platform for SSME recordings in a single-well format; (E) Three-millimeter sensor for the recordings with the SURFE2R N1; (F) Screenshot of the SURFE2R N1 control 1.7.0.2 software; (G) Representative current traces recorded with TMEM175 overexpressing lysosomes (blue trace) and control lysosomes (red trace) using the SURFE2R N1. The sensors harboring the TMEM175 and the control samples were each loaded with 2.2 µg total protein. SD and average current amplitudes and time constants determined from N = 6 sensors are shown in Table 1. The experiment shows a single solution exchange from a solution containing 50 mM Na+ (NA solution, red bars) to a solution containing 50 mM K+ (A solution, green bar), which stimulates K+ flux through TMEM175 (on-signal). After 1 s, K+ is replaced by Na+, stimulating K+ efflux (off-signal) and restoring initial conditions; (H) SURFE2R 96SE platform for SSME recordings in HTS format; (I) A 96-sensor well-plate for SSME measurements with the SURFE2R 96SE. (J) Screenshot of the SURFControl96 1.7 software; (K) Representative current traces recorded with the SURFE2R 96SE. Each sensor was loaded with 0.18 µg total protein. SD and average current amplitudes determined from N = 96 sensors, and average time constants determined from N = 6 sensors are shown in Table 1. Experimental conditions as described in (G).

