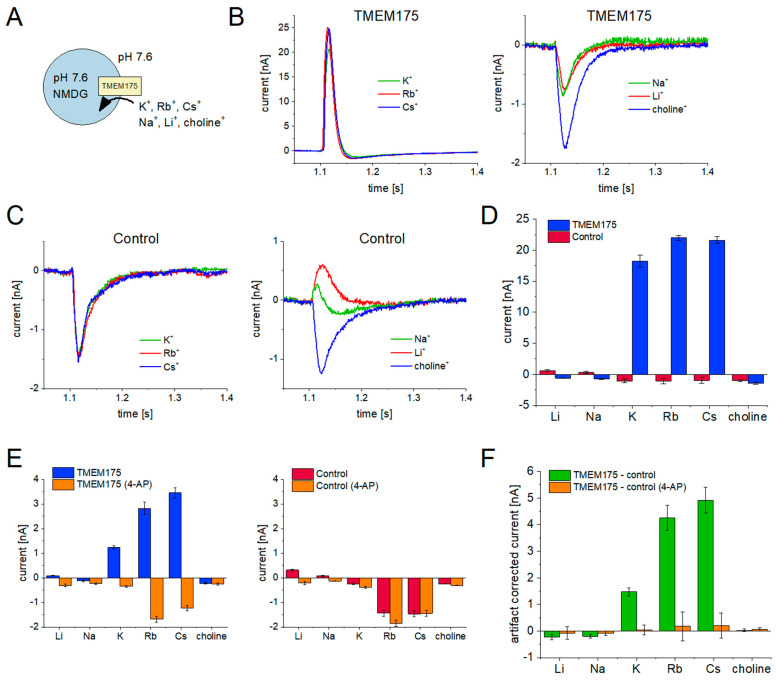
Figure 2.
Cation selectivity of TMEM175 recorded with the SURFE2R N1 (B–D) and the SURFE2R 96SE (E,F): (A) Schematic of the experimental setting for the measurement of cation influx. We applied a solution exchange from 50 mM NMDG-Cl to 50 mM of a different Cl salt at pH 7.6; (B) Representative current traces recorded with the TMEM175 sample. All traces are recorded from the same sensor; (C) Representative current traces recorded with the control sample. Currents reflect background signals (artifacts) resulting from ion–membrane interactions; (D) Average peak currents and SD for N = 5 sensors recorded with the TMEM175 and control samples; (E) Average peak currents and SEM for N = 16 sensors, recorded with the TMEM175 (left) and control (right) sample. Blue and red bars represent the currents after application of 50 mM of the indicated cation during solution exchange, and orange bars represent the currents recorded with the same solution exchange in the presence of 10 mM 4-AP. Representative current traces are shown in Supplementary Figure S2; (F) Processed data from (E). Control currents were subtracted from TMEM175 currents, both in the absence of 4-AP and in the presence of 4-AP. The currents reflect the TMEM175 net current.

