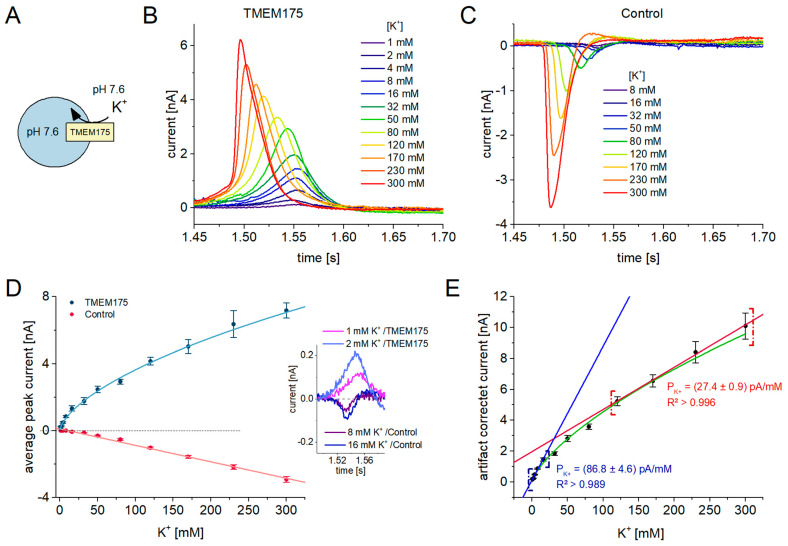
Figure 3.
I/c curves for K+ flux through TMEM175 recorded with the SURFE2R 96SE: (A) Schematic of the experimental setting for the measurement of K+ influx. We applied K+ concentration jumps between 1 mM and 300 mM at pH 7.6 to measure K+ flux through TMEM175. Non-activating solution contained 300 mM NaCl, while activating solution contained different KCl concentrations (x) and 300 − x mM NaCl; (B) Representative current traces induced by K+ concentration jumps on lysosomes overexpressing TMEM175; (C) Representative current traces from the same experiment on control lysosomes. Currents reflect the capacitive charge displacement due to ion–membrane interactions on the surface of the sensor when the Na+/K+ solution exchange is applied. This resembles the background (artifact) current also underlying the currents recorded with the TMEM175 sample; (D) SEM and average peak currents recorded with control lysosomes (red) and lysosomes overexpressing TMEM175 (blue). Currents were recorded using the SURFE2R 96SE with N = 8 sensors per concentration. The inset shows current traces obtained from the control and TMEM175 samples when low K+ concentrations are used. Artifact currents are detected starting from 8 mM K+, while TMEM175 currents are already detectable starting from 1 mM K+; (E) SEM and average artifact-corrected peak currents reflecting the K+ flux through TMEM175, solely driven by the K+ concentration gradient. The concentration dependence appears to by hyperbolic (green curve); the first and last four datapoints were individually fitted using the linear regression I = PK+Δc with high fit quality, as indicated by the adjusted R² values. Two different permeability coefficients of PK+ for potassium were obtained, indicating that the conductivity state of TMEM175 depends on the K+ concentration.

