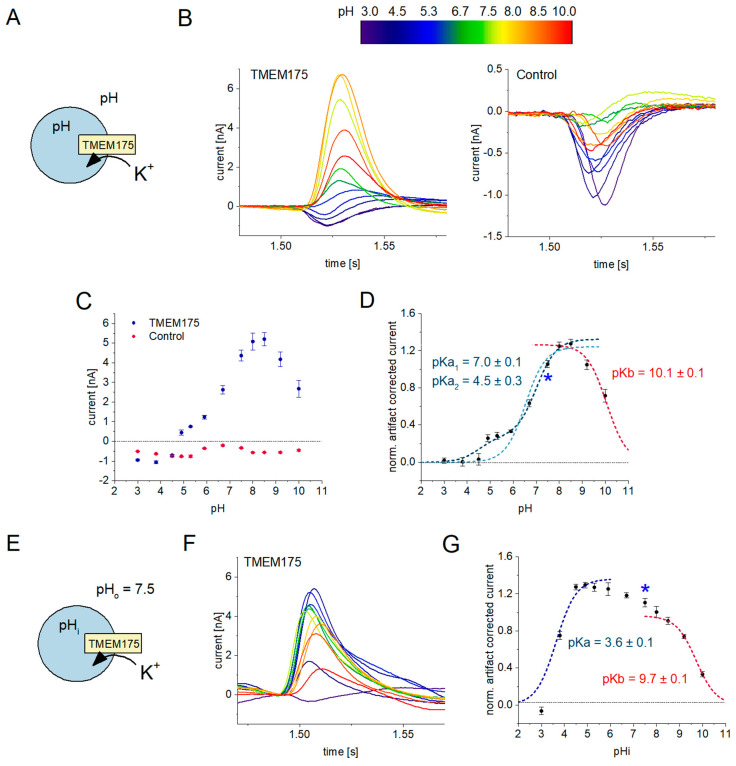
Figure 4.
Effects of intra-lysosomal and cytosolic pH on K+ flux through TMEM175 recorded with the SURFE2R 96SE: the rainbow color scheme indicates the pH used for recording the currents shown in (B,F); (A) Schematic of the experimental setting for the measurement at symmetrical pH conditions, i.e., the cytosolic pH matches the intra-lysosomal pH. Sensors were prepared at pH 7.6 and then rinsed with non-activating solution, which was adjusted to the desired pH, followed by an incubation of 5 min for pH equilibration. The non-activating solution contained 50 mM NaCl. We then performed a solution exchange to the activating solution, exchanging 50 mM Na+ with 50 mM K+ to measure K+ flux through TMEM175 at the given pH; (B) Representative current traces recorded at different pH values on lysosomes overexpressing TMEM175 (left) and control lysosomes (right); (C) SEM and average peak currents from N = 8 sensors per pH recorded with control lysosomes (red) and lysosomes overexpressing TMEM175 (blue); (D) SEM and average, artifact-corrected, normalized peak currents reflecting the K+ flux through TMEM175 at the given pH, solely driven by the K+ concentration gradient. We applied individual fits using titration equations to derive pK values for acidic and alkaline downregulation. For acidic downregulation, we used the fitting equation I = Imax/(1 + 10pKa-pH) with a single pK, achieving a poor fit of the data with pKa = 6.5 ± 0.1 (light blue dashed line). We then applied the fitting equation I = Imax1/(1 + 10pKa1-pH) + Imax2/(1 + 10pKa2-pH) with two pK values (dark blue dashed line), achieving a good fit, and considering the activity plateau observed between pH 6 and pH 5. Alkaline downregulation is described via a single pKb (red dashed line), using the equation I = Imax/(1 + 10pH-pKb). The blue asterisk indicates the pH 7.5 condition, which is identical across the datasets with symmetrical pH (this graph) and pH gradients across the lysosomal membrane (graph in (G)); (E) Schematic of the experimental setting for the measurement using pH gradients across the lysosomal membranes. Sensors were prepared at pH 7.6 and then rinsed with non-activating solution set to the desired lysosomal pH (pHi), followed by an incubation of 10 min for pH equilibration. The non-activating solution contained 50 mM NaCl. We then performed a solution exchange to the non-activating solution set to pH 7.5, which defines the external pH (pHo). Less than 300 ms after exchanging the external pH, the activating solution is applied, exchanging 50 mM Na+ with 50 mM K+ to measure K+ flux through TMEM175 in the presence of the pH gradient; (F) Representative current traces recorded in the presence of different pH gradients on lysosomes overexpressing TMEM175. The color of the trace reflects the intra-lysosomal pH according to the scheme in (B); (G) SEM and average, artifact-corrected, normalized peak currents reflecting the K+ flux through TMEM175 at the given intra-lysosomal pH (pHi), keeping the external pH constant (pHo = 7.5). Acidic and alkaline downregulations were fitted using single pK equations as explained in (D). Between pHi 9 and pHi 4, TMEM175 activity increases in a linear fashion.

