Figure 5.
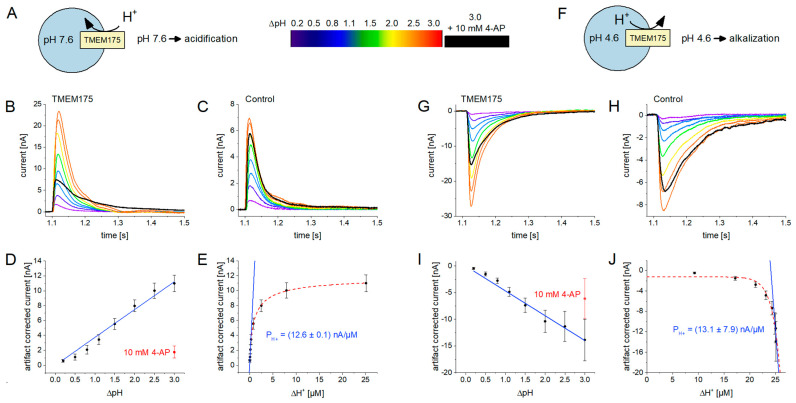
H+ currents through TMEM175 recorded with the SURFE2R N1: the figure shows results for H+ influx (A–E) and efflux (F–J) experiments; the rainbow color scheme indicates the ΔpH used to stimulate the currents shown in (B,C,G,H); (A) Schematic of the experimental setting for the measurement of H+ influx. We used H+ concentration or pH jumps to measure H+ flux through TMEM175. Non-activating solution was set to pH 7.6, while activating solution contained different pH values between pH 7.4 and pH 4.6; (B) Representative current traces induced by pH jumps on lysosomes overexpressing TMEM175. All current traces were recorded with the same sensor, starting from the lowest ΔpH. After recording using ΔpH = 3.0, the sensor was incubated with 10 mM 4-AP for 3 min, followed by the repetition of the solution exchange with ΔpH = 3.0 in the presence of 10 mM 4-AP (black trace). The remaining current mostly reflects the background (artifact) current after full block of TMEM175; (C) Representative current traces from the same experiment on control lysosomes. Currents reflect the capacitive charge displacement due to ion–membrane interactions on the surface of the sensor when the pH jump is applied. This represents the artifact current also underlying the currents recorded with the TMEM175 sample; (D) SEM and average, artifact-corrected, normalized peak currents from N = 4 sensors, reflecting the H+ flux through TMEM175, solely driven by the pH gradient. The current linearly depends on ΔpH; (E) The same data as shown in (D), re-plotted to obtain an I/c curve visualizing the dependence of the H+ flux through TMEM175 on H+ concentration. Only the first three data points show a linear dependence. Fitting using the linear regressions I = PH+Δc reveals the H+ permeability of TMEM175 in influx mode. The activity plateau when higher H+ concentrations are used likely corresponds to the inhibitory effect of cytosolic acidification (Figure 4D); (F) Schematic of the experimental setting for the measurement of H+ efflux. Non-activating solution was set to pH 4.6, while activating solution contained different pH values between pH 4.8 and pH 7.6; (G–J) Same plots and fits as described in (B–E), but for the H+ efflux experiment described in (F). In (J), the last three data points were used for the linear fit to obtain the H+ permeability of TMEM175 in efflux mode; here, large H+ concentration jumps are required to achieve close-to-neutral cytosolic pH values that prevent downregulation of TMEM175 due cytosolic acidification (Figure 4D).

