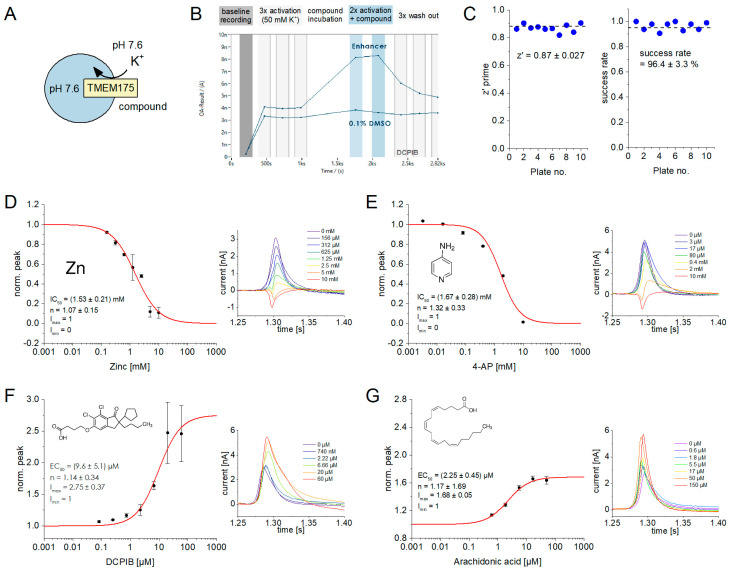
Figure 6.
Effects of inhibitors and enhancers on K+ flux through TMEM175 recorded with the SURFE2R 96SE: (A) Schematic of the experimental setting to measure the effects of compounds on TMEM175. We applied 50 mM K+ concentration jumps in the absence and presence of different compound concentrations to derive information about compound effects on K+ flux through TMEM175; (B) Time dependence of recorded peak current amplitudes for the complete workflow, which involves multiple sequential measurements. Two representative sensor wells are shown: one sensor was exposed to 50 µM DCPIB, while the other sensor was treated with 0.1% DMSO (negative control). The recording of each sensor well starts with the application of a control measurement, rinsing non-activating solution across the sensor (baseline recording). Afterwards, we performed three solution exchange measurements from 50 mM NaCl to 50 mM KCl to measure K+ flux through TMEM175 (baseline TMEM175 current, I0). We then rinsed the sensor with non-activating solution containing the compound at a given concentration, followed by incubation of 15 min to equilibrate the sensors with the compound. Subsequently, the solution exchange from 50 mM NaCl to 50 mM KCl is repeated twice, but in the presence of the given compound concentration to determine the modulated peak current I. Afterwards, we repeated the measurement in the absence of the compound three times (wash-out) to recover the non-modulated TMEM175 current. We subtracted the average artifact current recorded with control lysosomes from I and I0 (Figure 1K), without considering off-target effects of the tested compound. We then performed in-well normalization of artifact-corrected currents (I/I0) followed by averaging across sensors, before plotting the IC50 and EC50 curves shown in (D–G); (C) Z’ prime values and success rates from ten 96-well sensor plates. Success rates were determined based on the QC criteria provided in the Methods section. Z’ prime values were established based on the currents recorded after a solution exchange from 50 mM NaCl against 50 mM KCl (negative control) and the same solution exchange experiment in the presence of 10 mM 4-AP (full block, positive control). We determined average values, AVGpos and AVGneg, and standard deviations, SDpos and SDneg, of the recorded peak currents. For the calculation, we used the equation z’ = [(AVGpo − 3SDpos/√N) − (AVGneg − 3SDneg/√N)]/(AVGpos − AVGneg), which considers the number of datapoints N [44]; (D–G) IC50 and EC50 curves (left) and representative current traces recorded in the presence of different compound concentrations (right) for ZnCl2 (D), 4-AP (E), DCPIB (F), and arachidonic acid (G). Error bars represent the SEM obtained from automated data analysis using DataControl96, based on variations of the currents obtained with the TMEM175 sample. Each compound concentration was recorded with at least N = 8 sensors. The equation I = Imax − (Imax − Imin)/(1 + (c/EC50)n) was used to fit all datasets. Imin was always fixed to 0 for inhibitors or 1 for enhancers, as indicated.

