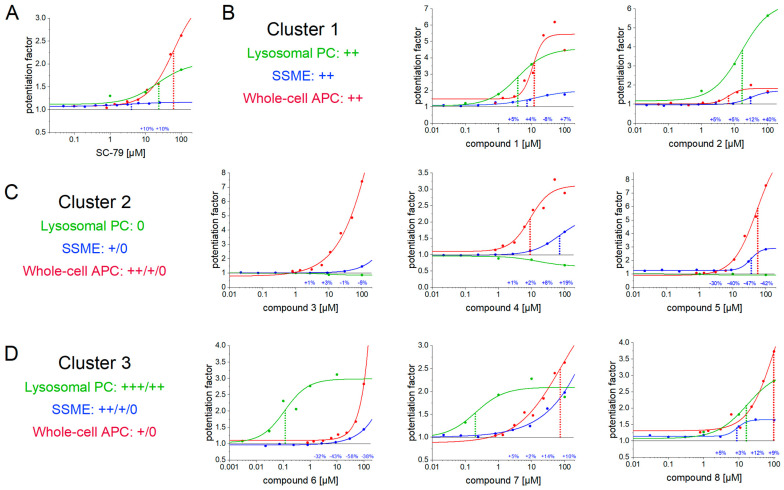
Figure 8.
Effects of eight blinded test compounds and SC-79 on TMEM175 recorded with whole-cell APC, manual LPC, and SSME. Compounds are grouped into three clusters based on apparent EC50 values, as indicated: EC50 < 1 µM (+++), EC50 = 1–30 µM (++), EC50 = 30–100 µM (+), EC50 > 100 µM (0); (A) Dose-response curves for SC-79; (B) Dose-response curves for cluster 1 compounds showing similar effects with all three technologies; (C) Dose-response curves for cluster 2 compounds showing no activity in LPC, but higher activity in APC; (D) Dose-response curves for cluster 3 compounds showing high activity in LPC, but lower activity in APC; For all assay technologies, datapoints were normalized to the current recorded before compound addition and averaged across at least N = 3 individual experiments. For clarity reasons, the SEM is not shown; the average relative SEM after averaging datapoints recorded with two highest compound concentrations is 35.6% for LPC data and 2.9% for SSME data. The APC data were acquired using a voltage application protocol distinct from the one depicted in Figure 7B, as described in the Methods section. Datasets were not corrected for artifacts (as observed in SSME) or off-target compound effects. For SSME data, we indicate the difference in the peak current when applying the four highest concentrations of a compound to control lysosomes (to assess off-target effects) compared to the current recorded with TMEM175 lysosomes prior to compound addition. Positive values represent off-target potentiation (potentially overestimating Imax), negative values represent off-target inhibition. Considerable off-target compound effects are observed when the given percentage approaches the percentage of enhancement recorded with the TMEM175 sample at the given compound concentration. All datasets were fitted using the EC50 equation I = Imax − (Imax − Imin)/(1 + (c/EC50)n). When an EC50 value was determined from the fit, it is highlighted by a vertical dotted line. For LPC data, the Hill coefficient n was fixed to 1 due to the lower number of datapoints per dataset, which is typically three. The obtained fit parameters are shown in Table 4.

