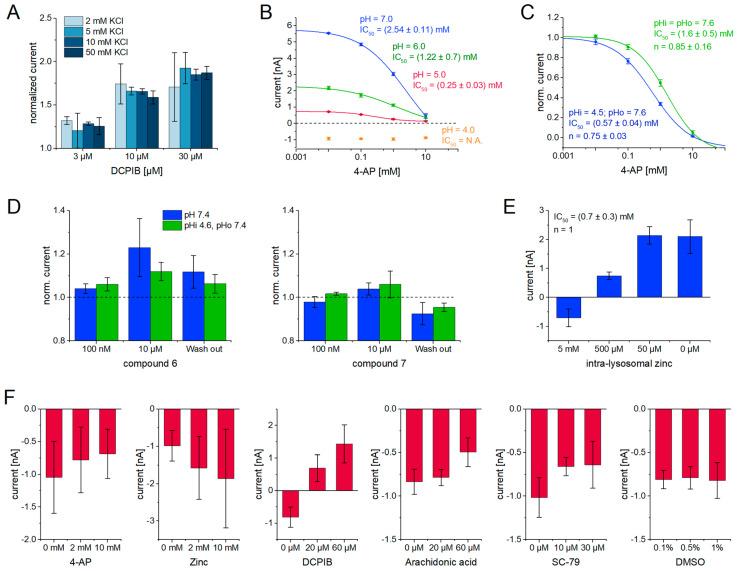
Figure 9.
Effects of pH, pH gradients, and protein orientation on apparent compound potencies in SSME recordings and off-target compound effects: (A) Effects of 3 µM, 10 µM, and 30 µM DCPIB on TMEM175 currents activated using K+ concentration jumps employing different K+ concentrations. The non-activating solution contained 140 mM NaCl, the activating solution contained x = 2, 5, 10, or 50 mM KCl and (140 − x) mM NaCl. Currents were recorded using one 96-well sensor plate with the SURFE2R 96SE. Currents were normalized to the currents recorded with the respective K+ concentration in the absence of DCPIB. The bar plot shows average, normalized currents and SEM recorded from N = 8 sensors per condition; (B) pH dependence of IC50 curves for 4-AP recorded using TMEM175 lysosomes with the SURFE2R N1. A solution exchange of 50 mM Na+ against 50 mM K+ was used to stimulate TMEM175. Datasets for each pH were measured on different sensors. Datasets were normalized to the peak current recorded in the absence of 4-AP before averaging. To indicate the pH dependence of absolute currents, we normalized each pH dataset a second time, using the average current obtained in the absence of 4-AP (Imax). Average peak currents and SEM, recorded from N = 5 sensors, are shown. Imax was fixed in the subsequent fitting with the equation I = Imax − (Imax − Imin)/(1 + (c/EC50)n). The dataset recorded at pH 4.0 (orange) only consists of artifact currents that are independent of 4-AP concentration; (C) As in (B), but instead of pH values being equilibrated in both internal and external solutions, we applied a pH gradient as indicated, incubating with non-activating solution at pH 4.5 for 3 min to equilibrate the intra-lysosomal pH, before switching to non-activating solution at pH 7.6 defining the external pH ~700 ms in advance of the 50 mM K+ jump to stimulate TMEM175. Both datasets—symmetrical pH 7.6 (green) and pH gradient (blue) conditions—were recorded on the same sensor, with N = 5 sensors in total. Since no major impact of the pH conditions on Imax have been observed, averaged and normalized currents are shown (compare with Figure 4G); (D) Effect of pH gradients on compound potency recorded with the SURFE2R N1. The compounds are blinded, but the labels match with the labels shown in Figure 8. Experimental conditions as described in (C). Currents in the presence and the absence of a pH gradient were recorded with different sensors. Each sensor was used for four measurements in the following sequence: in the absence of compound, in the presence of 100 nM compound, in the presence of 10 µM compound, and in the absence of compound (wash-out). Datasets were normalized to the peak current recorded in the absence of compound before averaging. Average peak currents and SD from N = 3 sensors are shown; (E) Intra-lysosomal zinc application and its effects on TMEM175 recorded with the SURFE2R N1. Sensors were prepared with TMEM175 lysosomes that were pre-loaded via 1:10 dilution in zinc containing non-activating solution, followed by 10 pulses of sonication as described in the Methods section (Section 4.2.5). For each zinc concentration, we applied a solution exchange of 50 mM Na+ against 50 mM K+ in the absence of zinc, causing zinc to only be present inside the lysosomes. Average peak currents and SD from N = 5 sensors are shown, and no normalization was applied; (F) Measurements of compound effects on control lysosomes purified from HEK293 cells expressing endogenous TMEM175, recorded with the SURFE2R N1. A solution exchange of 50 mM Na+ against 50 mM K+ was used, both in the absence of the compound, and in the presence of the two highest compound concentrations used for EC50 and IC50 determination using the TMEM175 sample (Figure 6 and Figure 8A). The three different experimental conditions shown in one graph were applied on the same sensor. Average peak currents and SD from N = 4 sensors are shown, and no normalization was applied.

