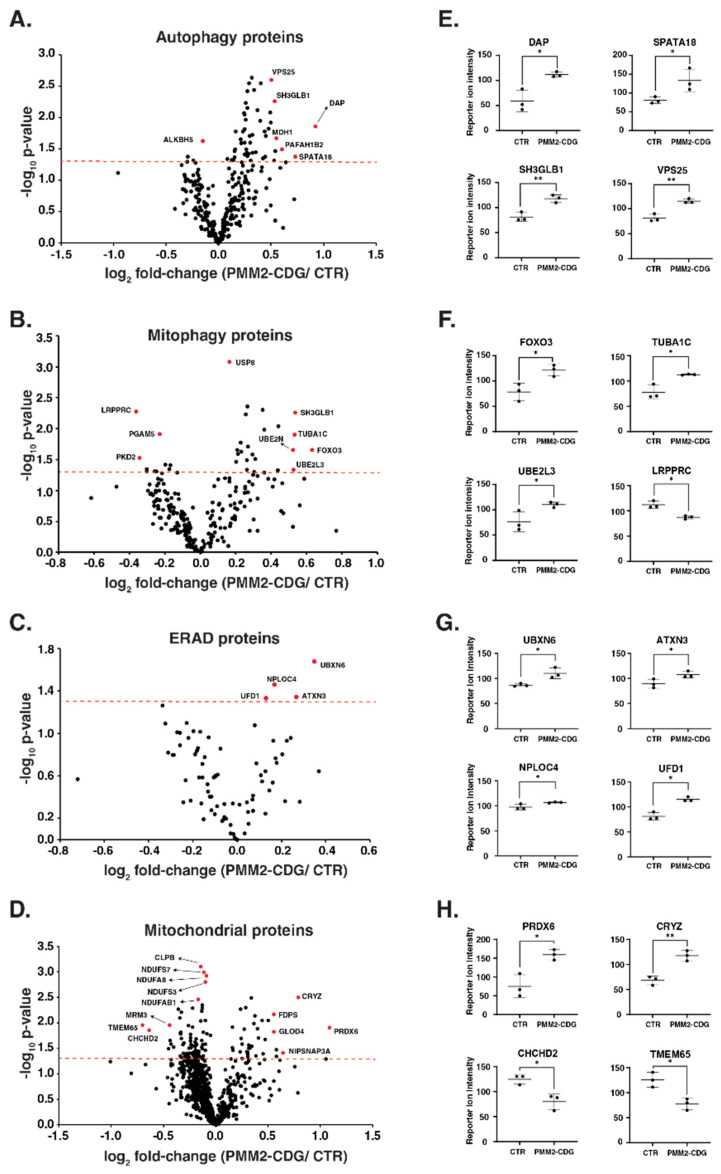
Figure 6.
Proteomic changes in patient-derived PMM2-deficient fibroblasts. Volcano plots depicting the differentially abundant proteins in patient-derived PMM2-deficient fibroblasts for the proteins related to autophagy (A), mitophagy (B), endoplasmic-reticulum-associated degradation (ERAD) (C) and mitochondria (D). X-axis is log2 fold change (PMM2-CDG/controls), and Y-axis is the negative logarithm of p-value of t test for significance. The horizontal dashed red line represents the cutoff for significance (p < 0.05). Some of the highly changing are marked in red circles, and protein names are provided. Dot plots showing reporter ion intensities are represented in (E–H) for top-changing proteins related to autophagy, mitophagy, ERAD and mitochondria, respectively. Y-axis is the reporter ion intensity of TMT channels. Each dot in the plot represents the individual control or patient sample. p < 0.05 (*) and p < 0.01 (**).

