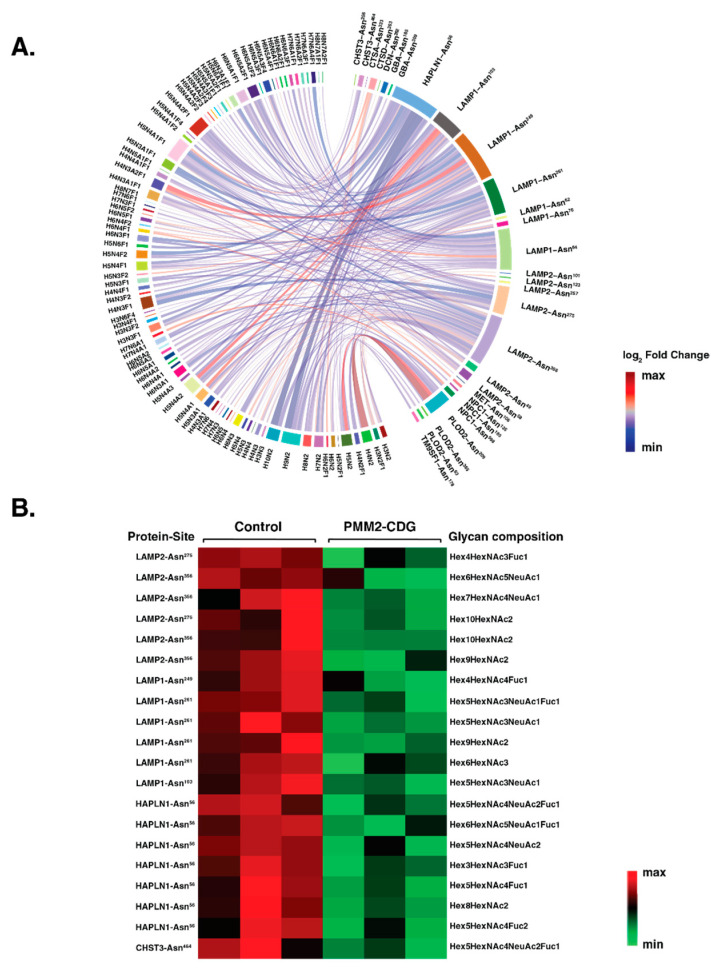
Figure 7.
Site-specific glycosylation changes in autophagy-related proteins. (A) Differential chord diagram depicting the site-specific glycosylation changes for autophagy-related proteins in PMM2-CDG as compared to control fibroblasts. Proteins with different glycosylation sites are indexed on the right of the diagram and connected via chords to respective identified glycan structures on the left. The fold-change pattern is color coded. (B) Heatmap of significantly changing glycopeptides (p < 0.05) with protein names (LAMP2; lysosome-associated membrane glycoprotein 2, LAMP1; lysosome-associated membrane glycoprotein 1, HAPLN1; hyaluronan and proteoglycan link protein 1 and CHST3; carbohydrate sulfotransferase 3) sites and glycan composition. The pattern is color coded.

