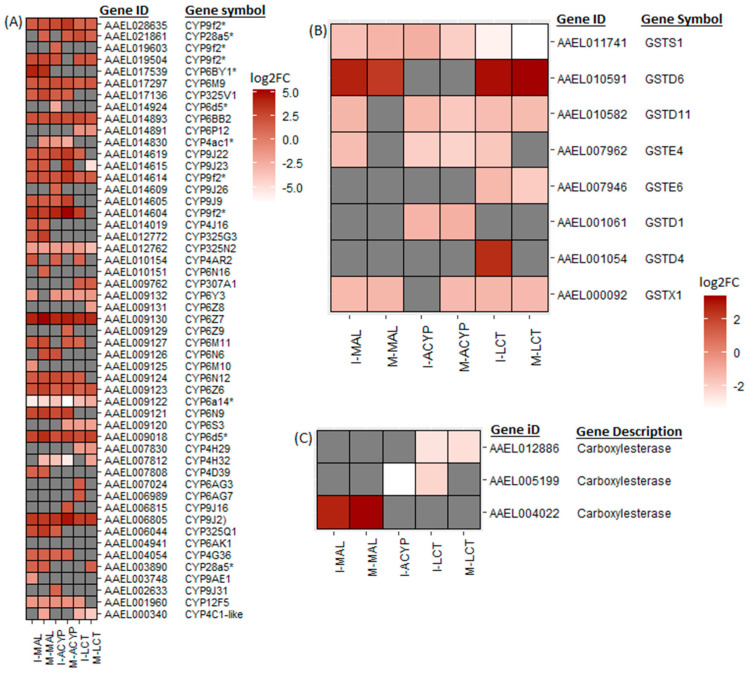
Figure 4.
Heatmaps summarizing the log2 fold change in expression of detoxifications genes including cytochrome P450s (A), glutathione-S transferases (B), and carboxylesterases (C). The log2FC expression is shown on a white–red scale (red = overexpressed, white = under-expressed, and gray = not detected or not differentially expressed) for the comparisons of insecticide-resistant samples vs. susceptible lab strain (R–S). The asterisks (*) are used to identify gene symbols that were assigned through Blast2GO annotation.

