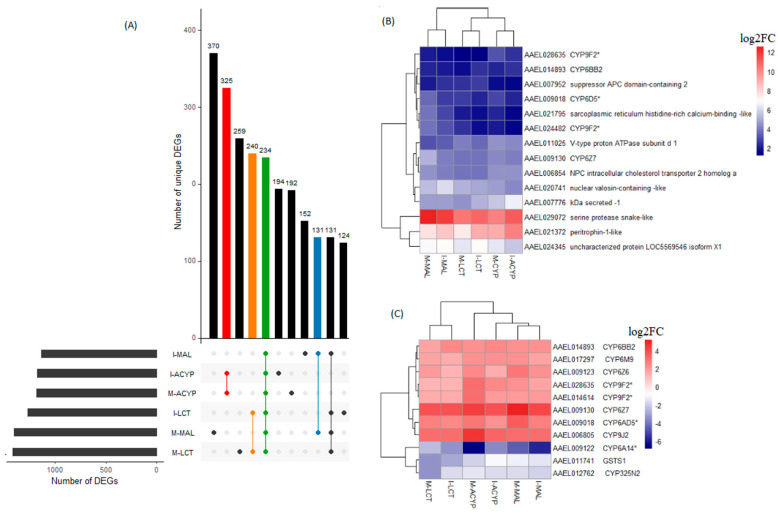
Figure 5.
Identification of DEGs associated with multiple-insecticide resistance. (A) The upset plot represents the intersection of differentially expressed genes from Isabela (I) and Manatí (M) between the malathion (MAL), alpha-cypermethrin (ACYP), and lambda-cyhalothrin (LCT) resistant samples when compared to the insecticide susceptible strain (R–S). The left horizontal bar plot reports the total number of DEGs in each comparison (set size), and the circles represent the set of comparisons associated to the intersection, while the vertical bar plot reports the number of unique and overlapping DEGs (intersection size) between the different combinations of R–S comparisons. The bar plots represent core DEGs (green) and DEGs specific to MAL (blue), ACYP (red), and LCT (orange). (B) Heatmap showing the log2 fold change (log2FC) expression of the top 10 DEGs in any R–S comparison (core top 10). (C) Heatmap showing the log2FC expression of the detoxification genes shared across all R–S comparisons. The heatmaps are in a blue–red color gradient (red = overexpressed and blue = under-expressed). The asterisks (*) are used to identify gene symbols that were assigned through Blast2GO annotation.

