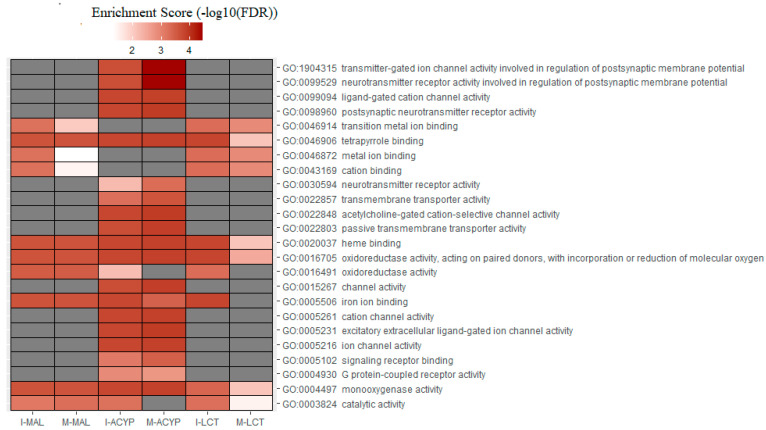
Figure 6.
Heatmap of the gene ontology (GO) enrichment analysis of the significantly upregulated genes in the malathion (I-MAL and M-MAL), alpha-cypermethrin (I-ACYP and-M-ACYP), and lambda-cyhalothrin (I-LCT and M-LCT) resistant samples compared to the susceptible strain of Ae. aegypti. The white–red gradient indicates the enrichment score of each GO term, while the gray color indicates that the GO term was not significantly enriched. Only the GO terms that overlapped for both MAN and ISA for specific insecticides are shown. The complete GOEA report is shown in Table S9.

