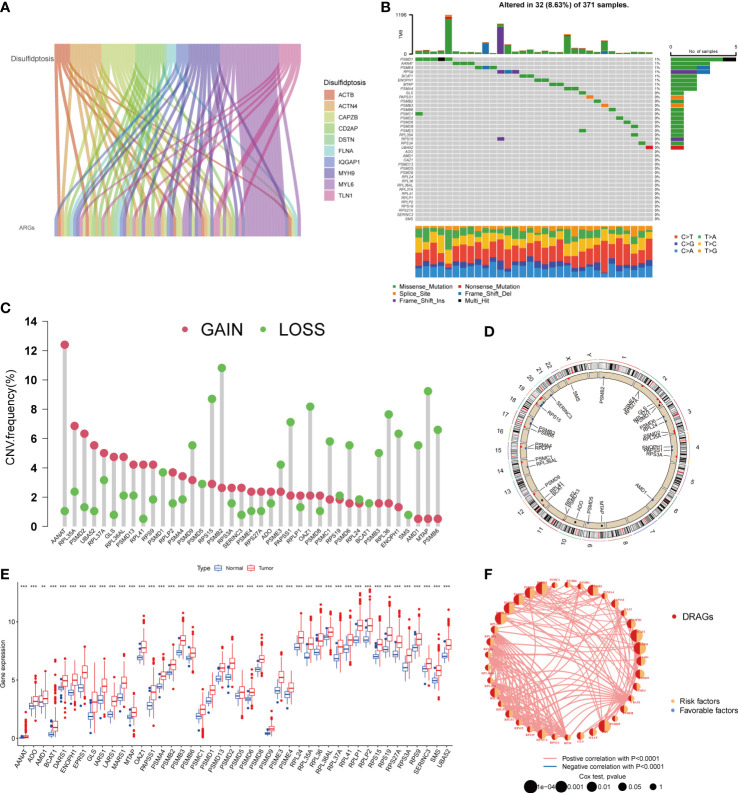
Figure 2.
A series of analyses about DRAGs. (A) Sankey diagram showing the correlation between DRGs and ARGs. (B) Mutation frequencies and mutation types of 39 DRAGs in 371 hepatocellular carcinoma (HCC) patients from the TCGA database. (C) Frequency of increased and decreased CNV in DRAGs. (D) Location of CNVs in DRAGs on 24 chromosomes. Red dots indicate increased copy number, and blue dots indicate decreased copy number. (E) Expression of 39 DRAGs between normal and HCC tissues. ** represents P<0.01, *** represents P<0.001. (F) Interaction relationship between DRAGs in HCC. The thickness of the connecting line indicates the strength of the correlation effect between genes, pink represents a positive correlation, blue represents a negative correlation.

