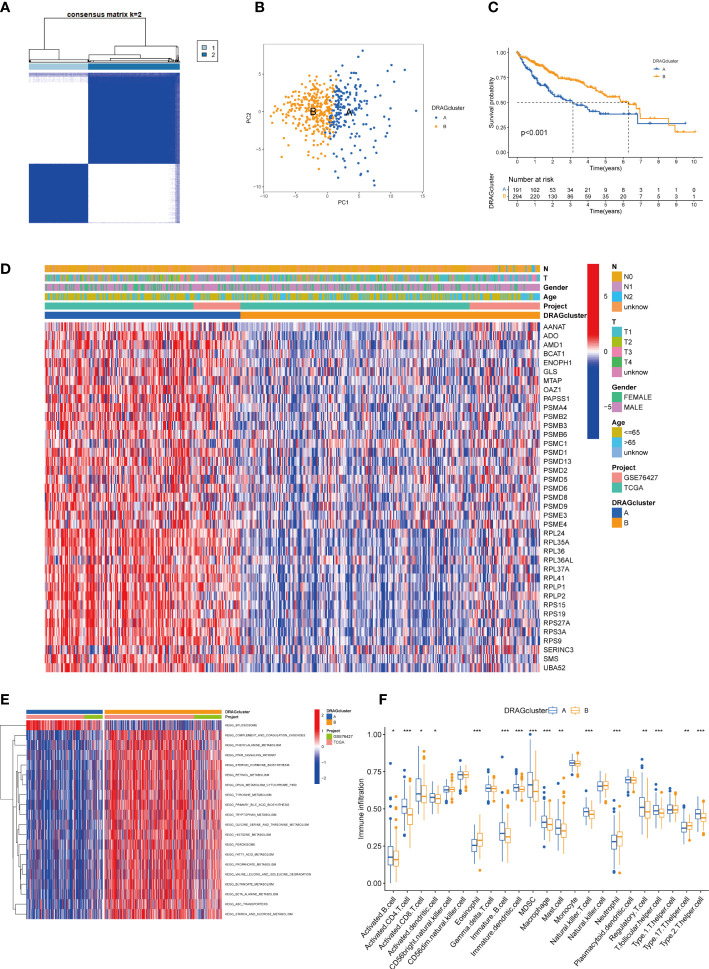
Figure 3.
DRAGcluster analysis. (A) Consensus matrix diagram defining the relevant regions of the two clusters. (B) PCA analysis shows significant differences between the two subtype groups. (C) K-M analysis shows the prognostic characteristics of patients in both subgroups. (D) Differences in clinicopathological features and expression levels of DRAGs between the two different subtypes. (E) GSVA of biological pathways between the two different subtypes, red and blue represent activating and inhibiting pathways, respectively. (F) The extent of infiltration of 23 immune cells in HCC subtypes. pca, principal component analysis; gsva, gene set variation analysis. ** represents P<0.01, *** represents P<0.001.

