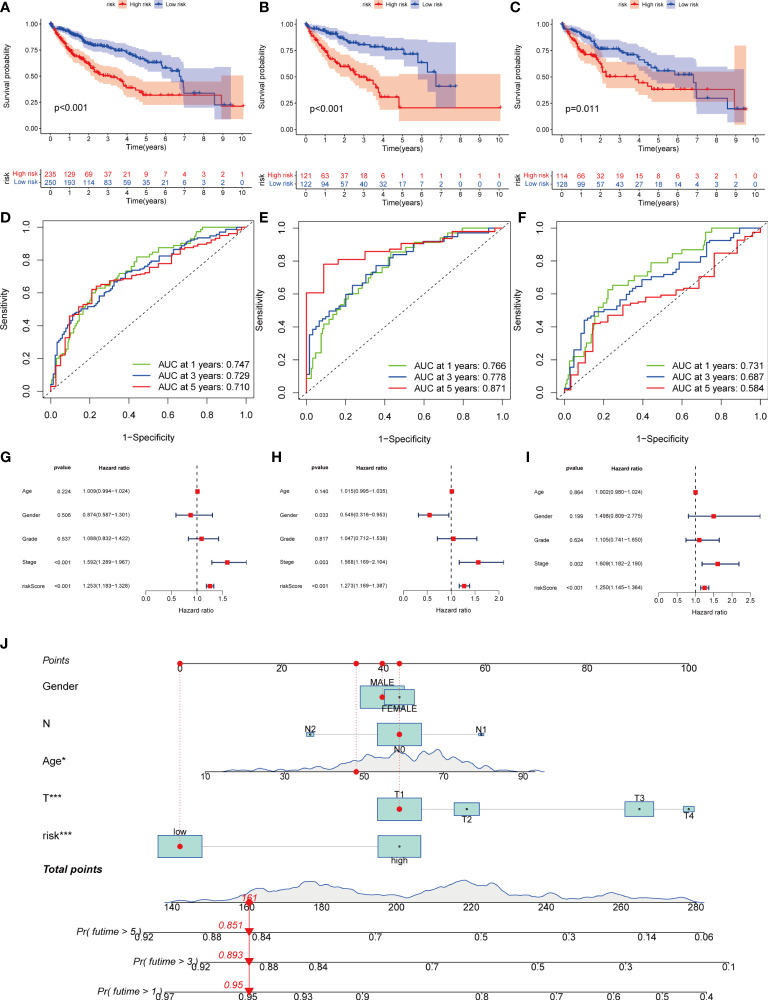
Figure 6.
Kaplan-Meier analysis, ROC curves, and nomogram of risk groups. (A) Kaplan-Meier analysis of the Recurrence free survival (RFS) of all-risk and low-risk groups in the training group (B) Kaplan-Meier analysis of the RFS of high-risk and low-risk groups in the training group. (C) Kaplan-Meier analysis of the RFS of high-risk and low-risk groups in the training group. (D) ROC curves predict 1-, 3-, and 5-year survival of all group patients. (E) ROC curves predicting 1-, 3-, and 5-year survival rates for patients in the train group. (F) ROC curves predicting 1-, 3-, and 5-year survival rates for test group patients. (G) The multivariate Cox regression analysis of clinical characteristics and risk score in all groups. (H) The multivariate Cox regression analysis of clinical characteristics and risk score in train group. (I) The multivariate Cox regression analysis of clinical characteristics and risk score in test group. (J) Construction of a nomogram based on clinical characteristics and risk score for prognostic signature. (J) ROC, receiver operating characteristic. * represents P<0.05, ** represents P<0.01, *** represents P<0.001.

