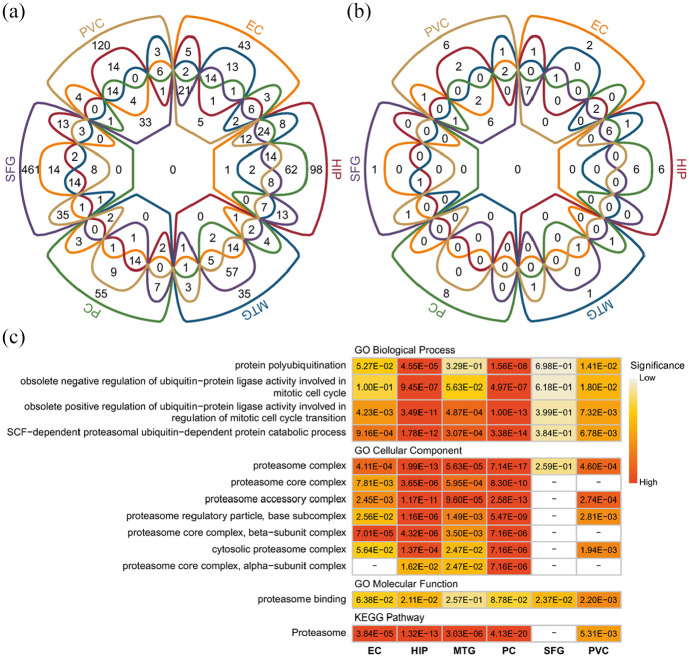
Figure 2.
Enriched GO functions and KEGG pathways in six brain regions: (a) Venn diagram of enriched GO functions (including biological process, cellular component and molecular function) in six brain regions, (b) Venn diagram of enriched KEGG pathways in six brain regions, and (c) significantly enriched ubiquitin-proteasome system-related functions and pathways in more than three brain regions.
The color bar indicates the FDR-corrected p value. The blank indicates that there are no differentially expressed genes in the pathway corresponding to the brain region.

