Figure 4.

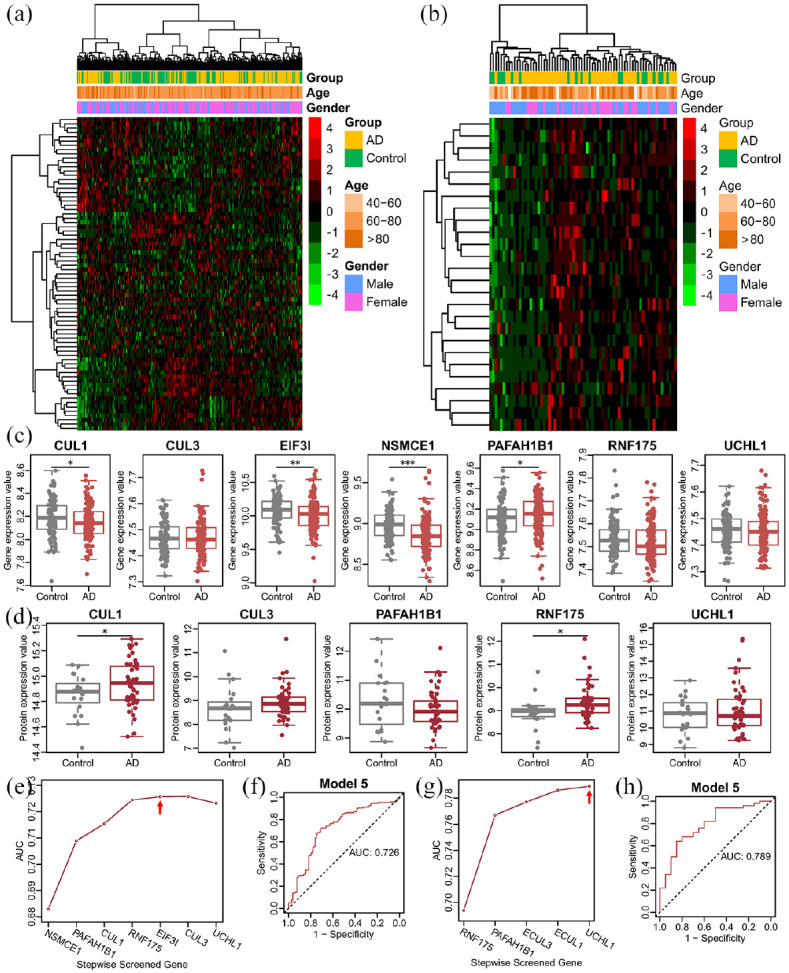
Expression of hub E3 genes and proteins in the blood of AD and diagnostic model construction: (a) heatmap of the combined differentially expressed E3 genes in the GSE63060 dataset, (b) heatmap of the combined differentially expressed E3 proteins in the GSE29676 dataset. The gene and protein expression values were z-score converted, and the color bar indicates the z-score, (c) gene expression of the hub E3 genes in the blood between patients with AD and controls, (d) protein expression of the hub E3 genes in the blood between patients with AD and controls (no protein expression data of EIF3I or NSMCE1). Statistical significance: *p < 0.05, **p < 0.01, ***p < 0.001, (e) stepwise screened prediction models using hub E3 gene expression values in blood transcriptome data. From left to right on the x-axis (stepwise screened genes), each additional gene corresponds to a model (for example, the gene of NSMCE1 represents model 1, which contains one gene of NSMCE1, PAFAH1B1 represents model 2, which contains two genes including NSMCE1 and PAFAH1B1). The red arrow shows the optimal model, (f) ROC curve of the screened optimal multigene model, (g) stepwise screened prediction models using hub E3 protein expression values in blood proteome data, and (h) ROC curve of the screened optimal multiprotein model.
