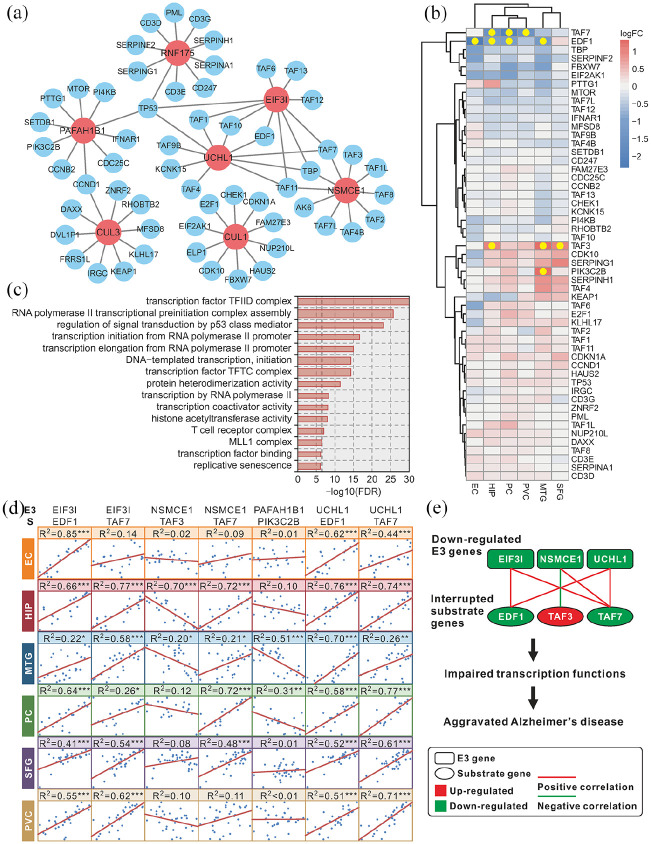
Figure 5.
Network and function of hub E3 and their substrate genes: (a) hub E3 and their substrate gene interactive network. The red color indicates E3 genes, and the blue color indicates substrate genes, (b) heatmap of the hub E3 substrate genes in six brain regions. The color bar indicates the log2 (fold-change), and the yellow point indicates statistical significance, (c) top 15 enriched GO biological processes of the hub E3 substrate genes. The dashed line indicates statistical significance, and the bar width indicates the enrichment percentage, (d) Pearson correlation of hub E3 genes and differentially expressed substrate genes (represented by S). The R2 indicates the square of the Pearson correlation coefficient. Statistical significance: *p < 0.05, **p < 0.01, ***p < 0.001, and (e) the potential mechanism of down regulated hub E3 genes aggravating AD.

