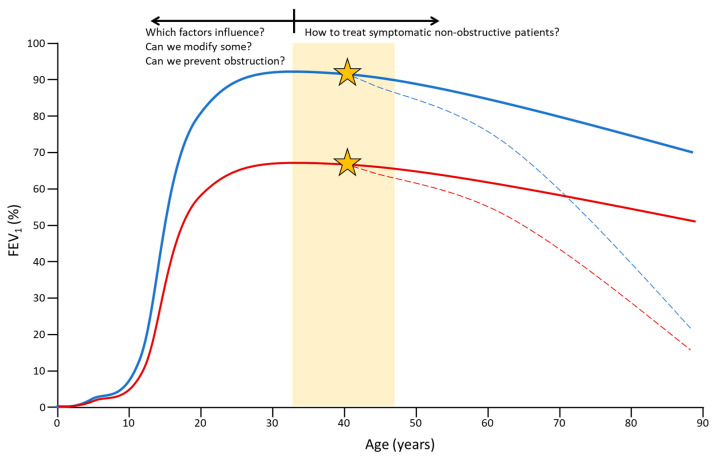
Figure 2.
Key questions and future directions for research. The lines represent the progression of FEV1 throughout life. In blue, cases with normal lung development. In red, cases with insufficient lung development. Dashed lines represent the appearance of rapidly progressive deterioration. The star marks a point from which this progressive deterioration would begin to appear. The yellow rectangle represents what would be an age range of interest for research in adults. Graph made as a drawing on the basis of previous studies [57,84,85,86], not based on real data.

