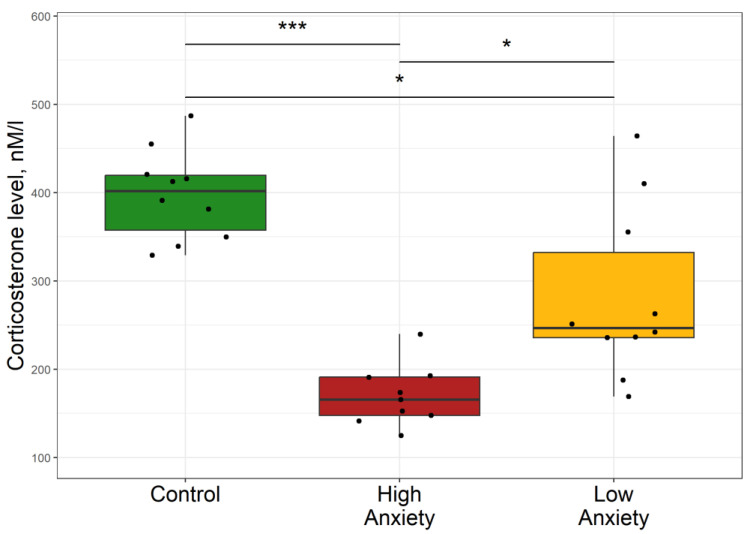
Figure 1.
Differences in plasma corticosterone concentrations between the control, low anxiety, and high anxiety groups of rats. In this and in similar figures, the boxes include the middle 50% of the data, i.e., from the 25th to the 75th percentile, with the median value shown by the horizontal line. The whiskers include data that fall within 1.5 times the interquartile range. p-values were determined by non-parametric analysis. Control n = 10; High Anxiety n = 9; Low Anxiety n = 10. * p < 0.05, *** p < 0.001.

