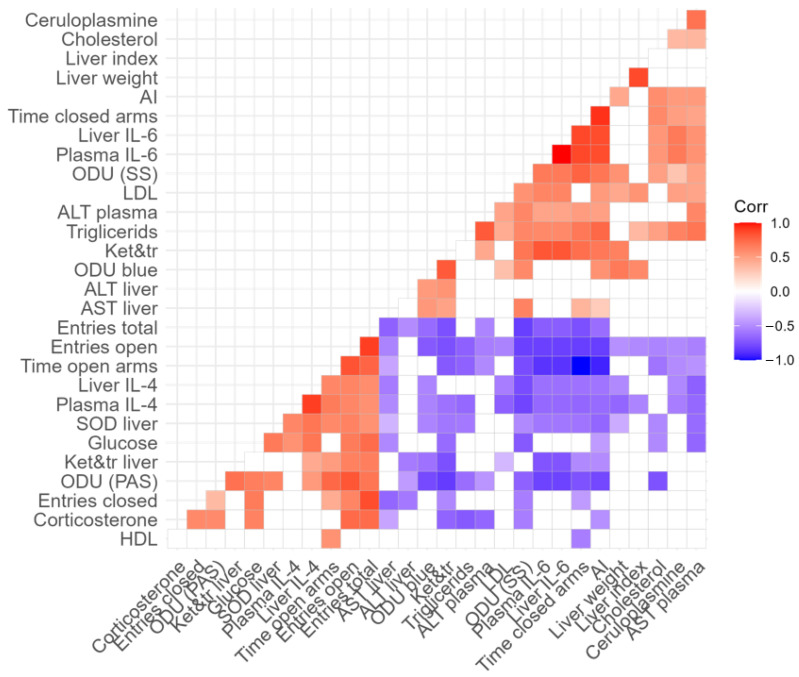
Figure 14.
Correlation matrix showing the relationship between measured variables in PS-exposed rats. Respective r values are indicated by the color bar below the matrix. p < 0.05 for all colored correlations. Details are shown in the Supplementary File.

