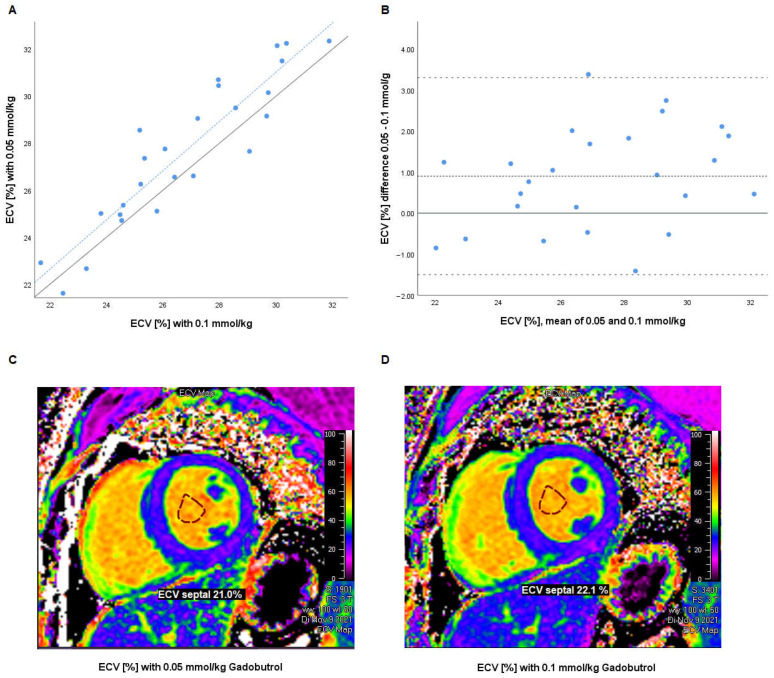
Figure 2.
(A) Scatter plot of ECV measurements with 0.05 and 0.1 mmol/kg gadobutrol. Grey line: line of identity (y = x). Dotted blue line: regression line (R2 = 0.846, p < 0.001). (B) Bland–Altman analysis of intraindividual differences (0.1–0.05 mmol/kg) in percentage points versus mean of both measurements. Dashed line: mean difference (bias). Pointed line: limits of agreement (mean ± 1.96 SD of difference). (C,D) Representative ECV maps with (C) 0.05 mmol/kg and (D) 0.1 mmol/kg gadobutrol (created using Medis Suite MRCT 2021, Medis Medical Imaging Systems bv, Leiden, the Netherlands) for demonstrative purposes only; measurements were performed using Philips IntelliSpace Portal). ECV—extracellular volume, SD—standard deviation.

