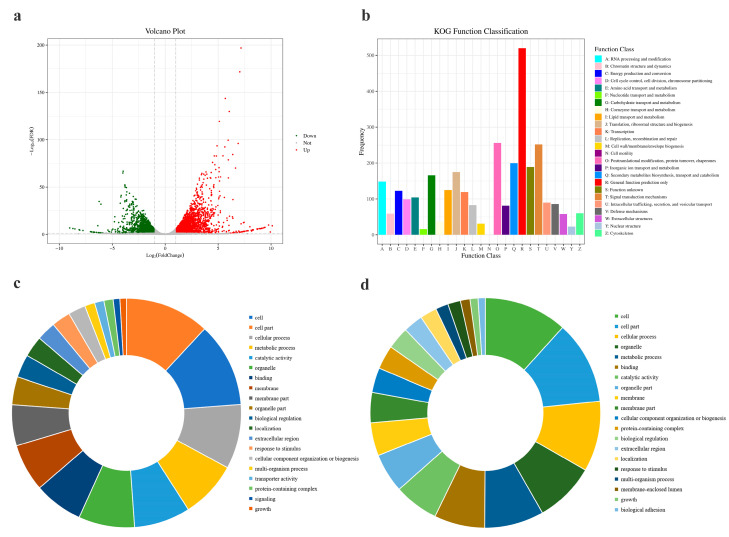
Figure 3.
Transcriptome data analysis of trehalase. (a) Volcano plot showing the distribution of DEGs at |log2(fold-change)| ≥ 2 and FDR (false discovery rate) p < 0.05 before and after validamycin treatment. The red dots in the plot represent the statistically significant upregulated DEGs, the green dots represent the statistically significant downregulated DEGs, and gray dots indicate the DEGs without statistical significance. (b) KOG classification of DEGs. (c) Pie charts showing the top 20 upregulated and (d) downregulated DEG enriched GO terms.

