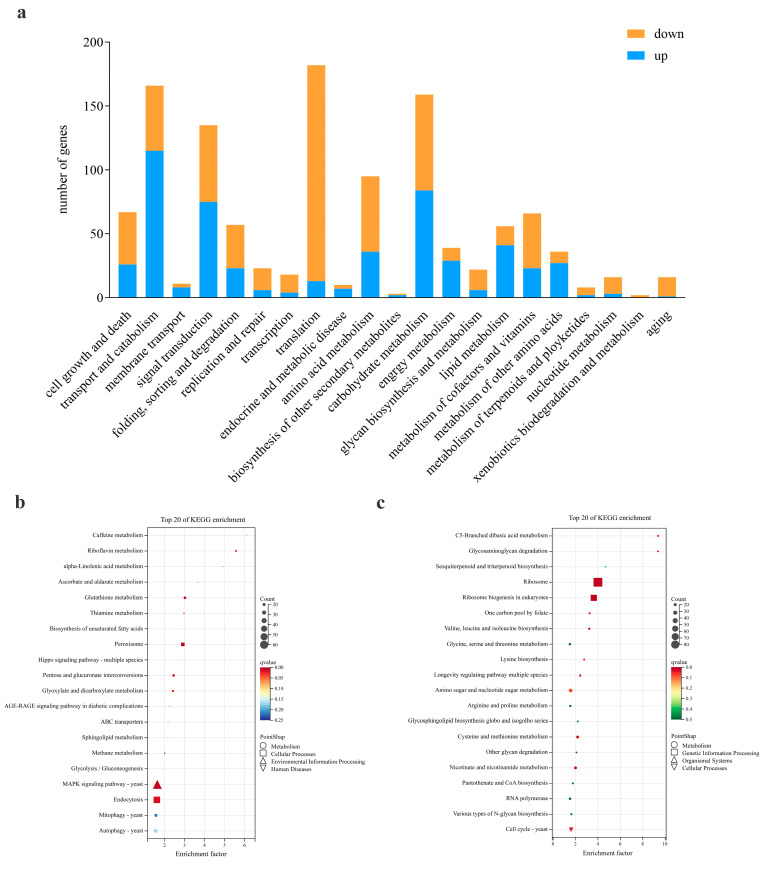
Figure 4.
Kyoto Encyclopedia of Genes and Genomes (KEGG) functional annotations of DEGs in R0301 vs. R0301 treated with validamycin. (a) Accumulated bar chart indicates the number of genes enriched by each KEGG pathway. Blue represents genes that are upregulated and orange represents genes that are downregulated. (b) Bubble charts showing the top 20 DEGs that are upregulated or (c) downregulated before and after validamycin treatment that are enriched in the KEGG pathway. The color of the bubble represents the corrected q value. The size of the bubble indicates the number of DEGs. The KEGG pathways are listed according to their molecular interactions and reaction networks within the ‘metabolism’, ‘genetic information processing’, ‘environmental information processing’, ‘cellular processes’, ‘human diseases’ and ‘organismal systems’ categories with different types of shapes.

