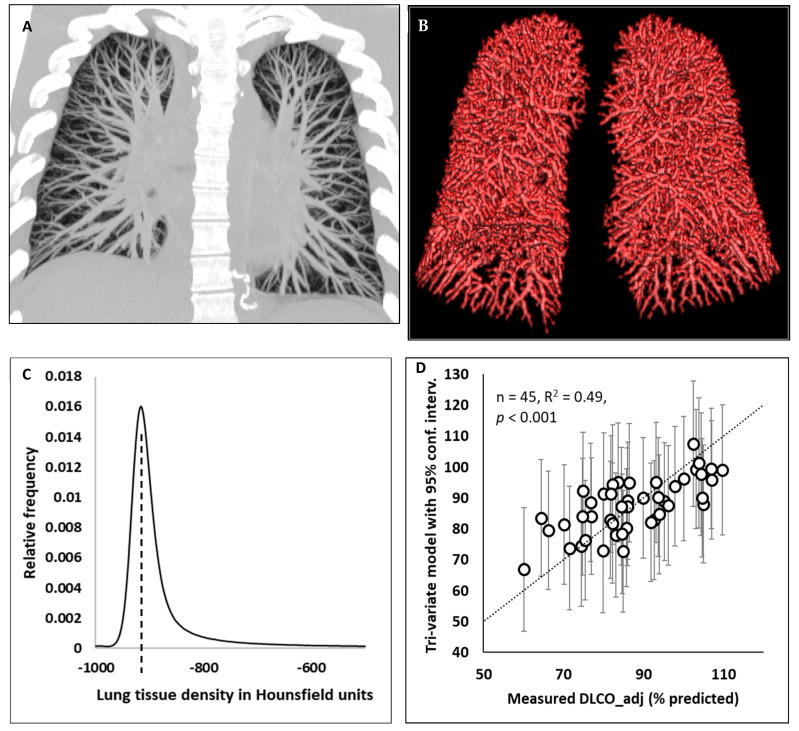
Figure 2.
Illustrations of computed tomographic measurements and a tri-variate model of the diffusion capacity of the lung. (A) Maximum intensity projection of an HRCT scan of a post-COVID-19 patient, highlighting intraparenchymal arteries and veins. (B) The 3D structure of pulmonary blood vessels that were segmented from the HRCT images. (C) A histogram of the lung tissue radiodensity values of a patient in Hounsfield units. The mode (peak) of the histogram is marked by the dashed line. It represents the typical radiodensity of non-vessel parenchymal tissue. (D) The measured values of the DLCO_adj (% predicted) versus a tri-variate model combining the three variables that were statistically significantly associated with the DLCO_adj (% predicted). Error bars represent the 95% confidence intervals of the model values. The three variables are the alveolar volume (% predicted), blood vessel volume fraction, determined via CT, and the mode of the parenchymal radiodensity histogram, also determined via CT. The dotted line is the identity line.

