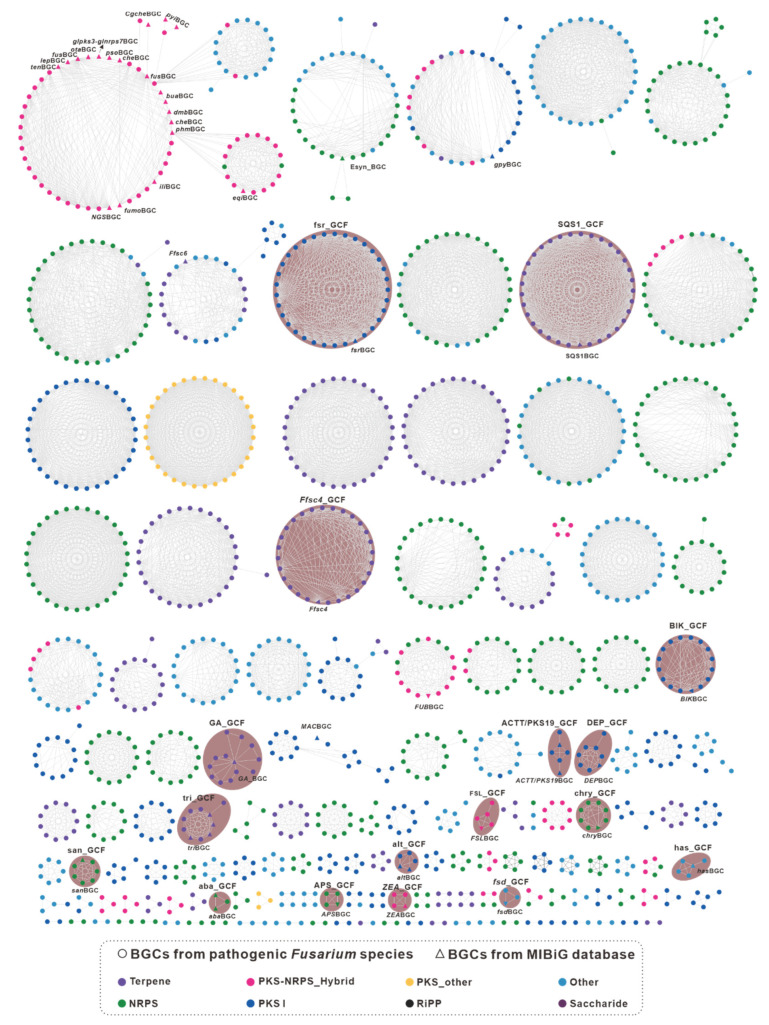
Figure 2.
GCF network of the 1733 predicted biosynthetic gene clusters (BGCs) from 35 pathogenic Fusarium species calculated by the BiG-SCAPE pipeline and visualized with Cytoscape. The hollow triangles represent the BGCs from the MIBIG database, whose names are labeled near the corresponding hollow triangles. The network with a shaded background represents the identifiable GCFs.

