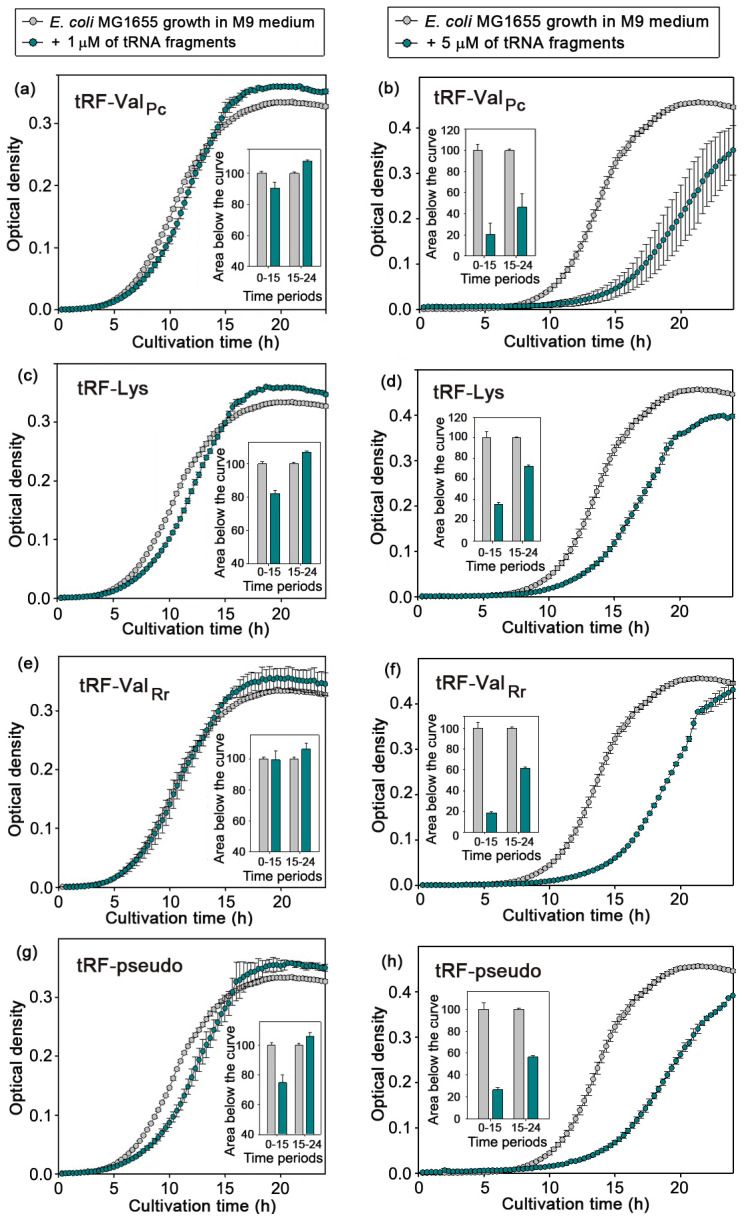
Figure 5.
Examples of dynamic curves demonstrating the phase-dependent duality of the biological action of model RNAs at lower (panels a,c,e,g) and higher dosages (panels b,d,f,h). Cells were cultured 24 h in plate wells of a multimode reader in M9 medium with 0.5% glucose (5% N2 and CO2). The dynamics of their growth was characterized by the changes in OD650 over two time periods (0–15 and 15–24 h), using the areas under the plots of experimental and control samples. Statistics shown by bar plots are based on at least 3 independent biological trials.

