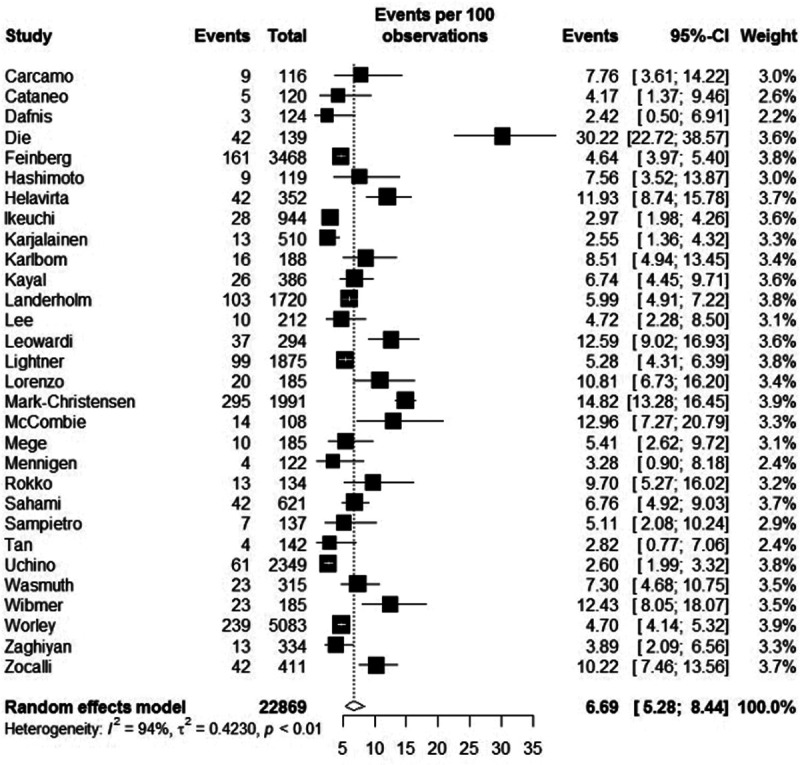
FIGURE 1.

Plot of the individual studies presenting pouch failure rates with 95% CI and the overall incidence of pouch failure with 95% CI. CI indicates confidence intervals.

Plot of the individual studies presenting pouch failure rates with 95% CI and the overall incidence of pouch failure with 95% CI. CI indicates confidence intervals.