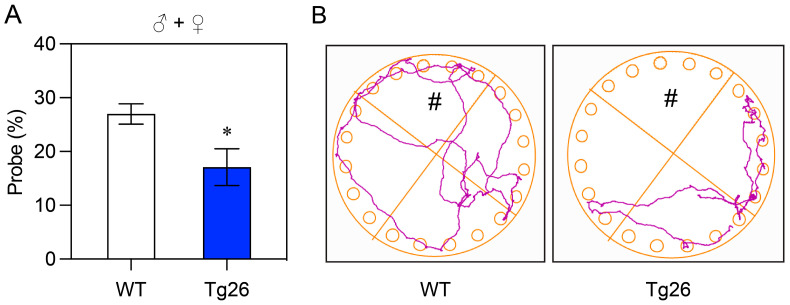
Figure 3.
Evaluation of spatial learning and memory in Tg26 and WT mice using the BM test. (A) Comparison of the time spent in the escape quadrant by Tg26 (n = 9) and WT (n = 14) mice at the age of 12–14 weeks old, presented as the percentage of probe time for the escape quadrant. Mean ± SEM are shown as bar graphs, with statistical significance indicated as * (p < 0.05). (B) Representative paths of WT and Tg26 mice during the probing process. The symbol # represents the correct quadrant where the escape can be found. The colored lines are the representative paths mice took during the exploration process.

