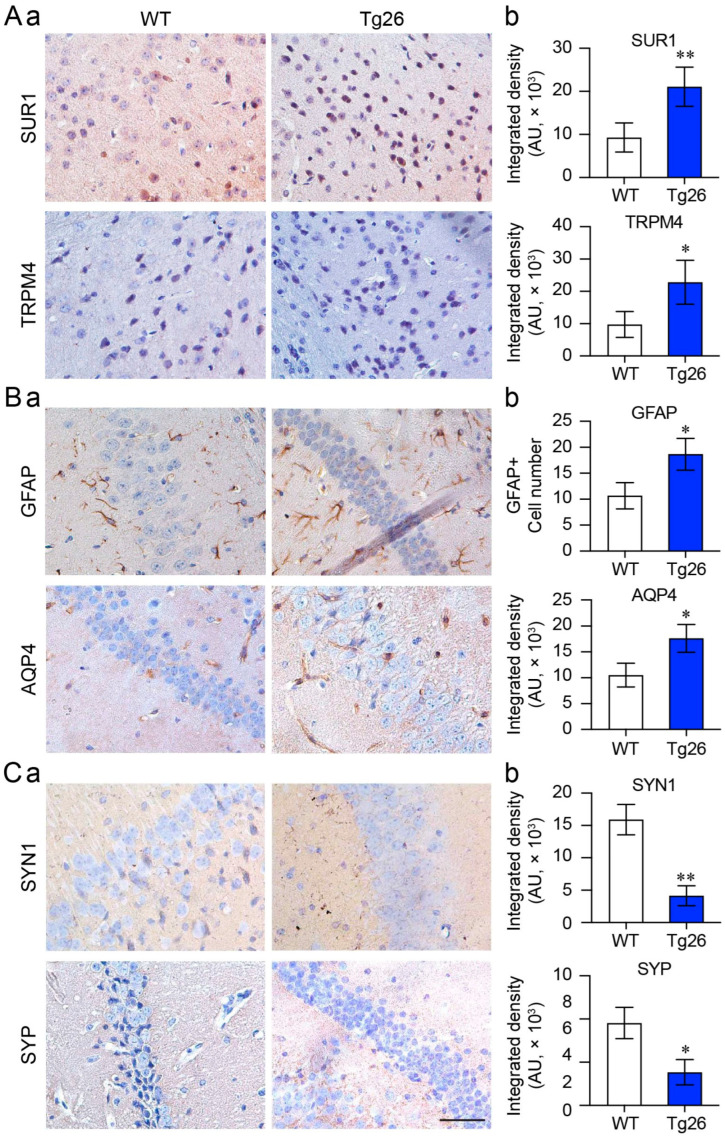
Figure 4.
Comparison of proinflammatory and synaptic protein expression in the cortex and hippocampus of WT and Tg26 mice. The figure shows representative IHC images and quantification of the SUR1-TRPM4 channel (A), astrocyte activation (GFAP and AQP4) (B), and synapses (SYN1 and SYP) (C) in the hippocampus brain tissue of WT and Tg26 mice at 16 weeks of age with mixed sexes. (a) Immunohistochemistry microscopic images, (b) graphic representation of (a). The data are presented as Mean ± SD. An unpaired t-test was used to determine statistical significance between the two testing groups, with * p < 0.05 and ** p < 0.01 indicating significance. Scale bars are 100 µm.

