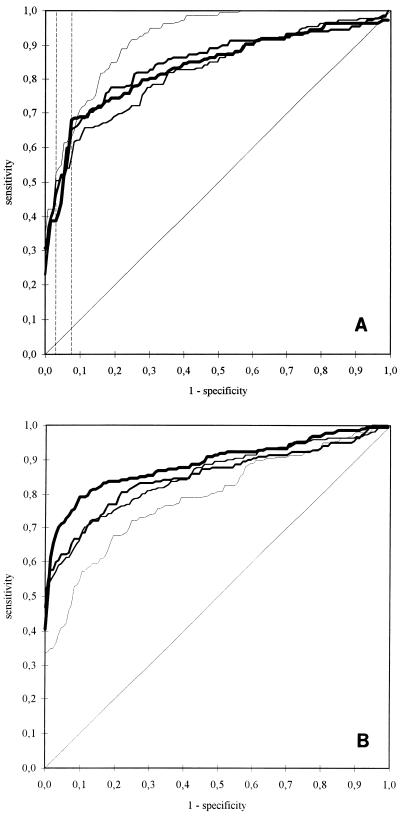
FIG. 3.
ROC curves for different ELISAs. Specificity levels were based on various cutoff values obtained from percentiles for sera from 133 blood donors; the respective sensitivities were determined by probing 222 serum samples from patients with LB. The diagonal line (0/0 to 1/1) represents a completely uninformative test. The discriminatory ability of each assay is represented by the area between this line and the respective ROC curve. (A) ROC curves for IgG ELISAs. Broken lines, sensitivities at 92.5 and 97% specificity. (B) ROC curves for IgM ELISAs. ▪▪▪▪, PKo; ——————, PBi; ■■■■■■■■■, PKa2; ______, B31.

