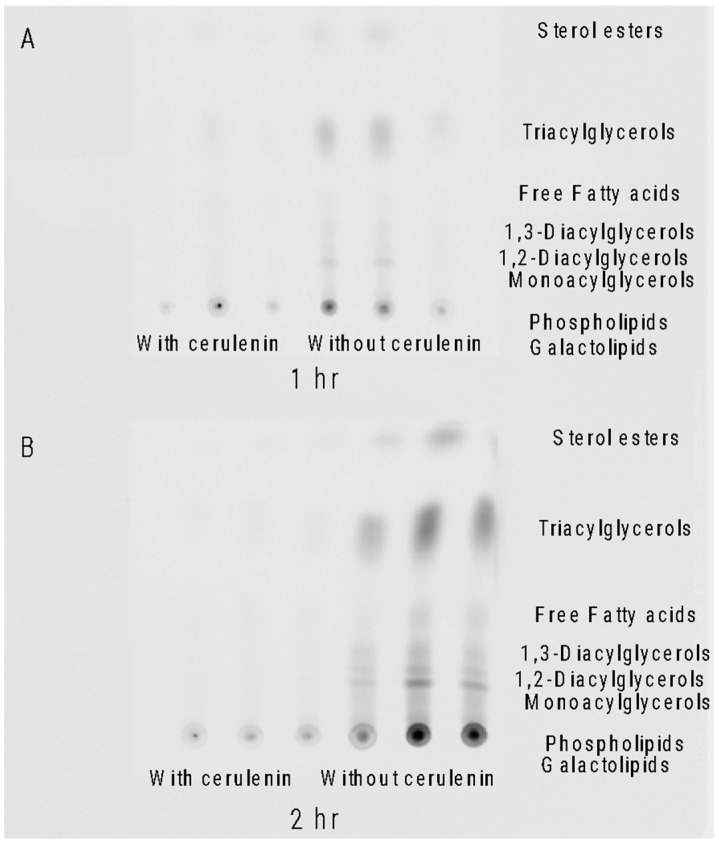
Figure 4.
Thin layer chromatography (TLC) of extracted lipids. Triplicate lipid samples showing 14C acetate incorporation patterns with and without 100 μM cerulenin in Amphidinium carterae. (A) Lipid profile of A. carterae 1 h after 14C acetate addition with and without cerulenin incubation. (B) Lipid profile of A. carterae 2 h after 14C acetate addition with and without cerulenin incubation. Lipid classes corresponding to migration on the TLC plate are listed on the right of the image.

