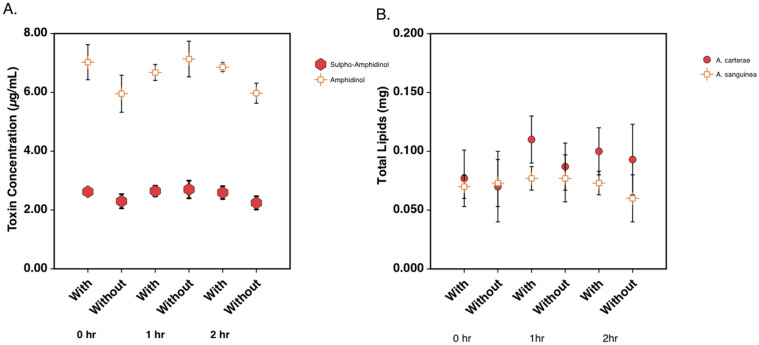
Figure 7.
Total toxin and lipid levels in A. carterae and A. sanguinea over a 2-hour period. (A) Quantitation of amphidinol and sulpho-amphidinol in A. carterae during 14C acetate labeling study. (B) Quantitation of dry weight of extracted lipids in A. carterae and A. sanguinea during 14C acetate labeling study.

