FIGURE 5.

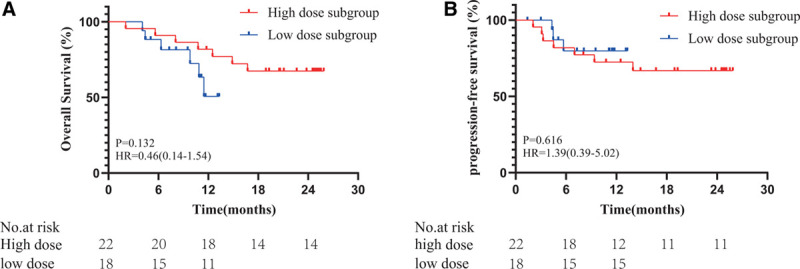
Kaplan-Meier curves for OS (A) and PFS (B) in the high-dose and low-dose subgroups. OS, overall survival; PFS, progression-free survival.

Kaplan-Meier curves for OS (A) and PFS (B) in the high-dose and low-dose subgroups. OS, overall survival; PFS, progression-free survival.