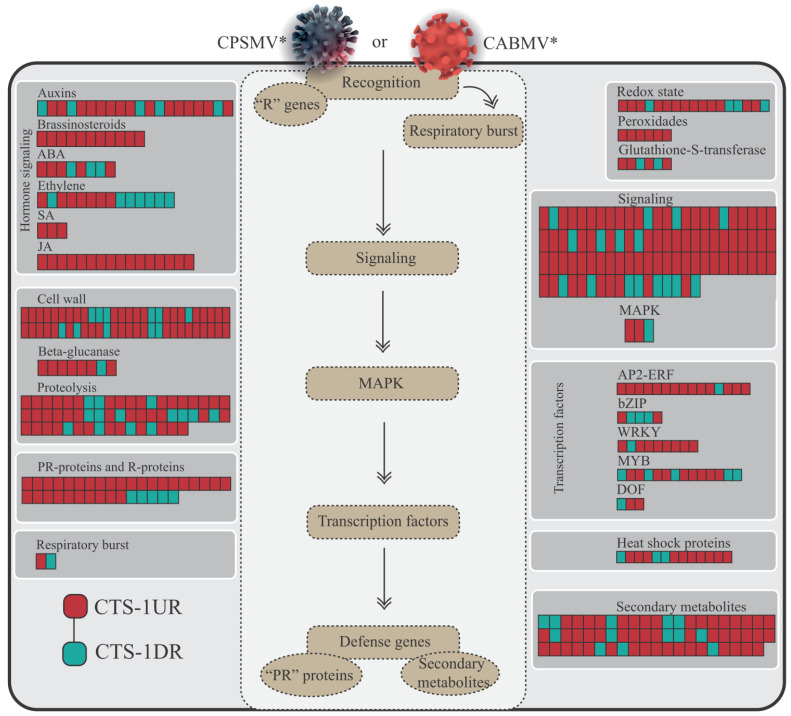
Figure 4.
Transcripts from the CTS-1UR and CTS-1DR groups mapped onto the biotic stress response modules of the MapMan tool. Legend: * for illustrative purposes only; CTS-1UR group (up-regulated transcripts in response to CABMV and CPSMV mechanical inoculations in one hpi treatments); CTS-1DR group (down-regulated transcripts in response to CABMV and CPSMV mechanical inoculations in one hpi treatments); hpi (hours post-inoculation); colored squares/rectangles indicate different transcripts.

