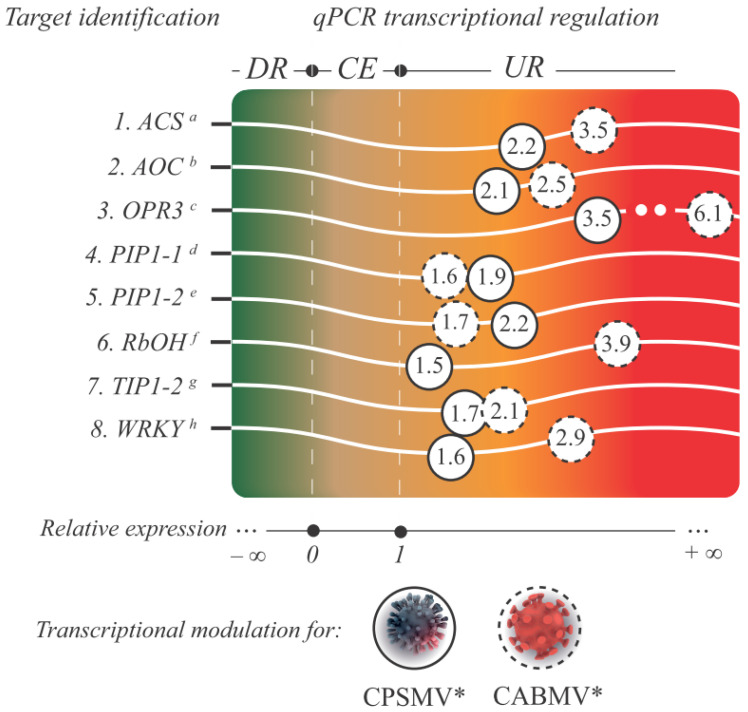
Figure 6.
A gradient chart is presented, showcasing the analyzed targets from the CTS-1UR group, showing their respective functional annotations and IDs (superscript letters). The color gradient represents the relative expression value, indicated by the numbers inside the circles, for each target and viral mechanical inoculation assay. Legend: * for illustrative purposes only; circles with dashed lines represent the relative expression levels of the target transcripts from the one hpi treatment in the CABMV mechanical inoculation assay, while circles with solid lines represent the same for the CPSMV mechanical inoculation assay. Targets displaying a relative expression value below zero and p < 0.05 are classified as down-regulated (DR), those between zero and one with p ≥ 0.05 are considered constitutively expressed (CE), and those greater than one with p < 0.05 are identified as up-regulated (UR); a Vung164007|c0_g1_i1 (ACS: 1-aminocyclopropane-1-carboxylate synthase); b Vung81738|c0_g1_i1 (AOC: allene oxide cyclase); c Vung115541|c1_g5_i8 (OPR3: OPDA reductase); d Vung136249_c0_g4_i2 (PIP1-1: aquaporin PIP1-1); e Vung47464_c4_g4_i1 (PIP1-2: aquaporin PIP1-2); f Vung150570|c0_g1_i7 (Rboh: Respiratory burst oxidase homolog); g Vung59787_c1_g1_i4 (TIP1-2: aquaporin TIP1-2); h Vung50795|c1_g1_i3 (WRKY: WRKY transcription factor); CTS-1UR group (up-regulated transcripts in response to CABMV and CPSMV mechanical inoculations, with one hpi treatments); hpi (hours post-inoculation).

