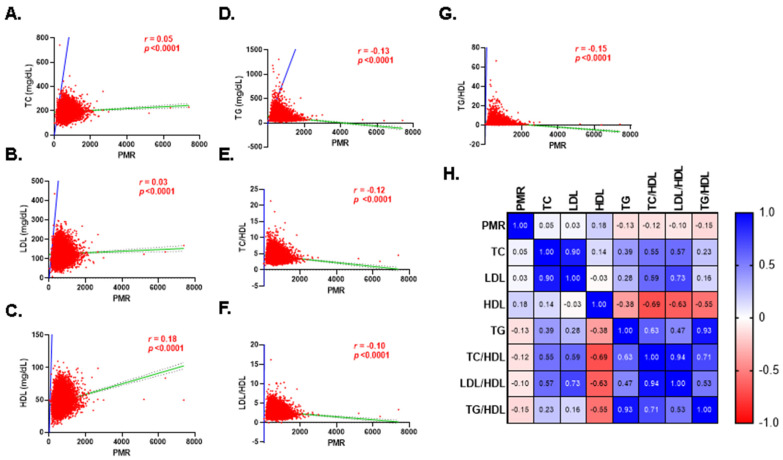
Figure 5.
Association of PMR with lipid markers. Spearman’s rank correlation between PMR and (A) TC, (B) LDL, (C) HDL, (D) TG, (E) TC/HDL, (F) LDL/HDL, and (G) TG/HDL. Regression lines are shown in green, while identity lines are in blue. A correlation matrix with correlation coefficients is also shown (H).

