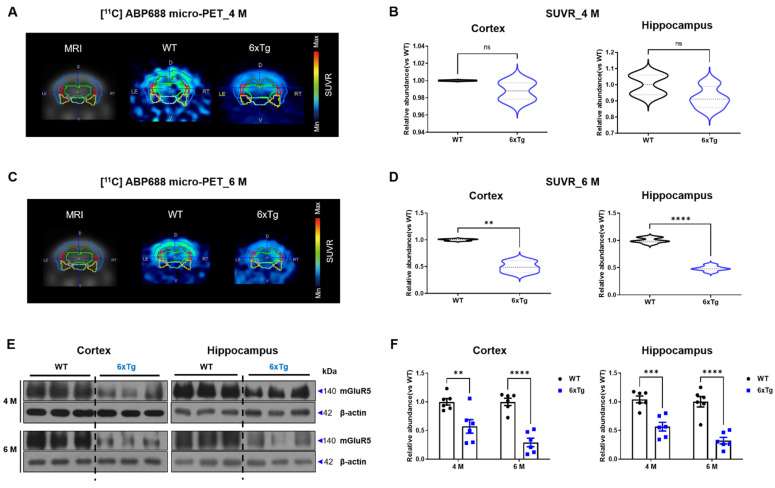
Figure 3.
Reduction in mGluR5 density in the brains of 6xTg mice. (A,C) Representative images of [11C]-ABP688 in the brain of 4- and 6-month-old WT and 6xTg mice using micro-PET. (B,D) Quantitative analysis of ROI including cortex and hippocampus (n = 3 per group each month). (E) Representative Western blot images of mGluR5 protein levels in cortex and hippocampus of 4- and 6-month-old WT and 6xTg mice. (F) Quantitative analysis of mGluR5 expressions in the cortex and hippocampus (n = 6 per group each month). Data are presented as means ± SEM. ** p < 0.01, *** p < 0.001 and **** p < 0.0001 vs. WT. Statistical significance between the two groups was determined using the Student’s t-test.

