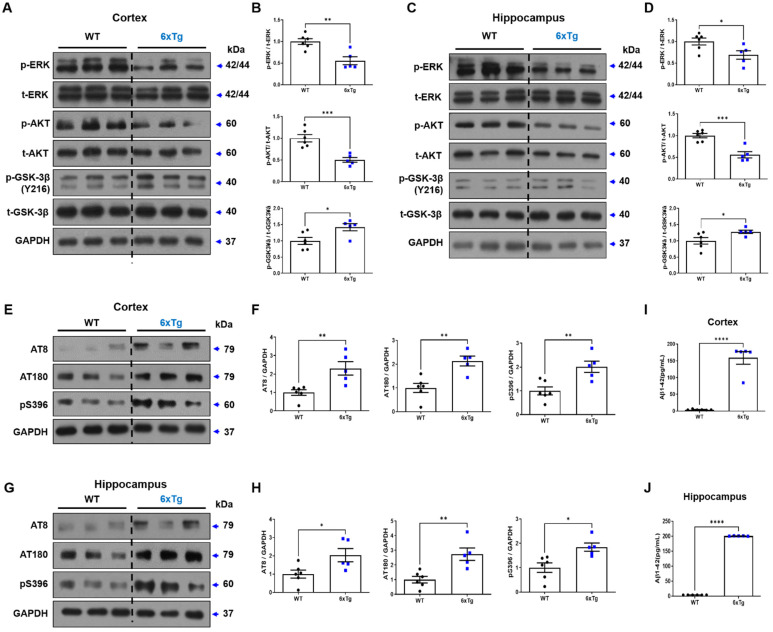
Figure 4.
Alteration of ERK/AKT/GSK-3β signaling pathway in the brains of 6xTg mice. (A) Representative Western blot images of p-ERK/t-ERK/p-AKT/t-ERK/p-GSK-3β/t-GSK-3β protein levels in the cortex of 8-month-old WT and 6xTg brains. (B) Quantitative analysis of p-ERK/t-ERK/p-AKT/t-ERK/p-GSK-3β/t-GSK-3β expressions in the cortex. (C) Representative Western blot images of p-ERK/t-ERK/p-AKT/t-ERK/p-GSK-3β/t-GSK-3β protein levels in the hippocampus. (D) Quantitative analysis of p-ERK/t-ERK/p-AKT/t-ERK/p-GSK-3β/t-GSK-3β expressions in the hippocampus. (E) Representative Western blot images of phosphorylated tau proteins in the cortex using AT8/AT180/pS396 antibodies. (F) Quantitative analysis of phosphorylated tau proteins in the cortex. (G) Representative Western blot images of phosphorylated tau proteins in the hippocampus using AT8/AT180/pS396 antibodies. (H) Quantitative analysis of phosphorylated tau proteins in the hippocampus. (I,J) Aβ42 protein levels in the cortex and hippocampus of mice were quantified using ELISA. All data are given as means ± SEM (n = 6 per group). * p < 0.05, ** p < 0.01, *** p < 0.001, and **** p < 0.0001 vs. WT. Statistical significance between the two groups was determined using the Student’s t-test.

