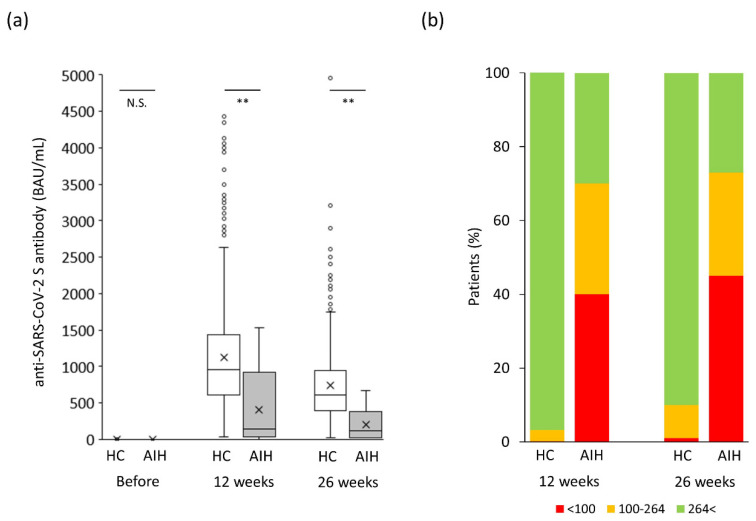
Figure 3.
Changes in humoral vaccination response over time in the original study population. (a) Humoral vaccination response over time in the study population. (b) Distribution of antibody levels in the study groups based on the cutoff for “minimum response” (<100 BAU/mL) and “tolerable response” (≤264 BAU/mL). AIH, autoimmune hepatitis; BAU, binding antibody units; HC, healthy controls; NS, not significant. ** p < 0.005.

