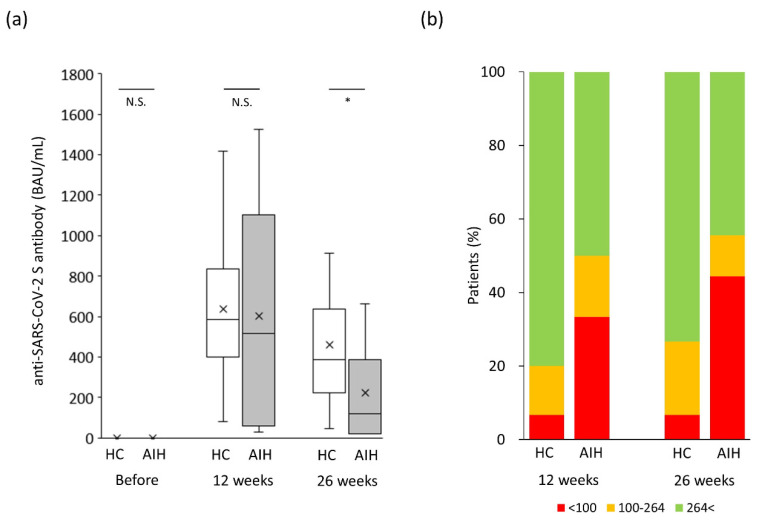
Figure 4.
Changes in humoral vaccination response over time in the propensity-matched study population. (a) Humoral vaccination response over time in the study population. (b) Distribution of antibody levels in the study groups based on the cutoff for “minimum response” (<100 BAU/mL) and “tole response” (≤264 BAU/mL). AIH, autoimmune hepatitis; BAU, binding antibody units; HC, healthy controls; NS, not significant. * p < 0.05.

