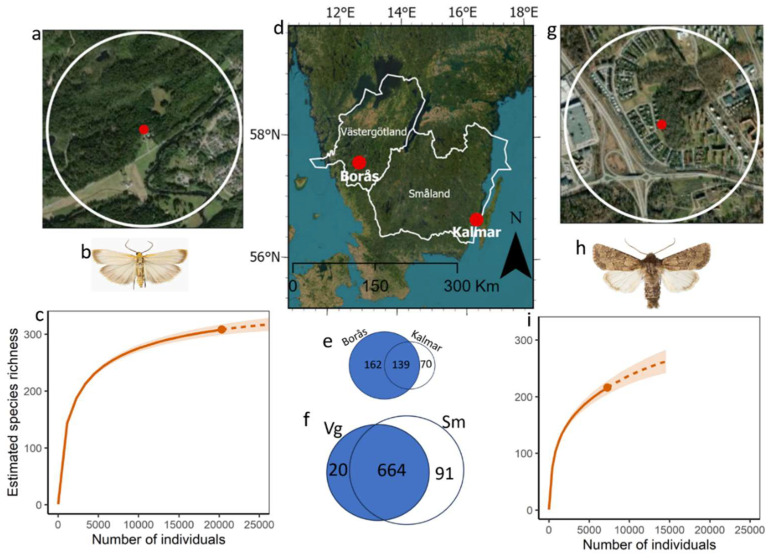
Figure 1.
Overview and comparison of moth trapping sites as red dots and species richness in the provinces of Västergötland and Småland, Sweden (a). Satellite view of the moth trapping site in Borås, Västergötland, with the local area within a 1 km radius indicated by a white circle (b). Depiction of Eilema depressa, the most abundant moth species recorded at the Borås site (c). Individual rarefaction and extrapolation curves for the species richness at Borås, illustrating both the observed (solid lines) and projected (dashed lines) species richness. Shaded regions represent 95% confidence intervals (d). Geographical representation of the provinces of Västergötland and Småland in Sweden, with the locations of the respective moth trapping sites in Borås and Kalmar indicated by red dots. Provinces are outlined in white (e,f). Venn diagrams displaying the species overlap between the trapping sites (e) and between the provinces (f), with Småland abbreviated as Sm and Västergötland as Vg. Unique species counts are shown within the respective circles, and shared species counts are shown within the intersecting areas (g). Satellite view of the moth trapping site in Kalmar, Småland, with the local area within a 1 km radius indicated by a white circle (h). Depiction of Luperina testacea, the most abundant moth species recorded at the Kalmar site (photographs by Vladimir S. Kononenko) (i). Individual rarefaction and extrapolation curves for species richness at Kalmar, illustrating both the observed (solid lines) and projected (dashed lines) species richness. Shaded regions represent 95% confidence intervals.

