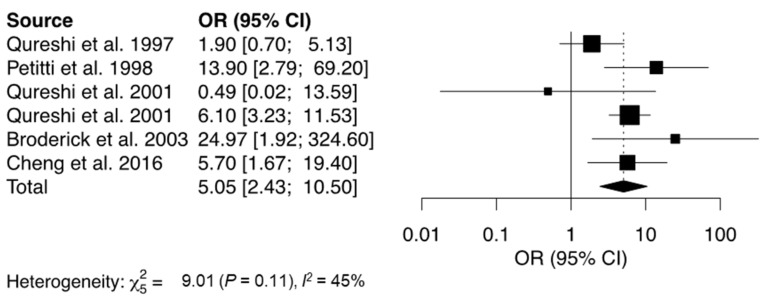
Figure 2.
Forest plot showing the association between cocaine use and risk of stroke. The solid squares represent the point estimate of each study with the horizontal lines denoting the 95% CI. The size of the square is proportional to the relative weight of each respective study. The center of the diamond is the pooled estimate using a random-effects model and its width reflects the 95% confidence interval. OR = Odds Ratio, CI = Confidence Interval [17,18,21,22,23,39].

