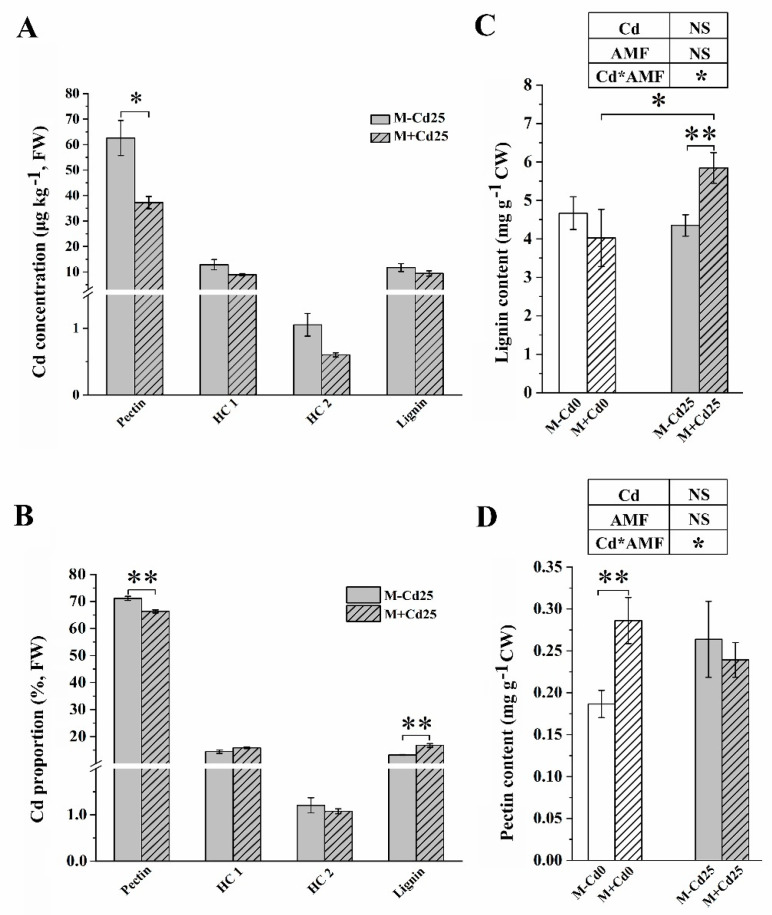
Figure 3.
Cd concentration (A), Cd proportion (B), lignin content (C), and pectin content (D) in the cell wall (measured in fresh weight, FW) of roots that were either inoculated (M+) or not inoculated (M−) with F. mosseae, and exposed to either 0 mg kg−1 (Cd0) or 25 mg kg−1 Cd (Cd25) supplementation. The data presented are the means ± SE ((A,B), n = 4; (C,D), n = 8), and statistical significance is indicated by asterisks (* for p < 0.05, ** for p < 0.01, t-test). NS indicates no statistically significant difference (p > 0.05, two-way ANOVA).

